
by Mish
An inversion occurs when shorter term rates have a higher yield than longer dated rates. Typically this is a strong recession warning.
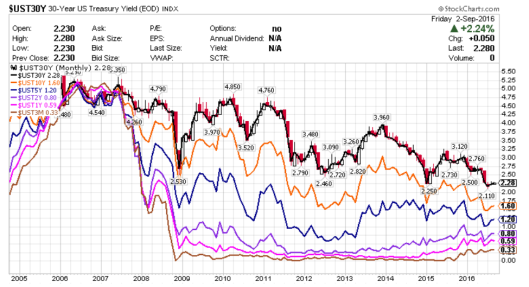
Let’s start with a look at a couple of yield curve charts.
Yield Curve Monthly
Judging from the above chart I see little reason to believe there will be any inversion at the long end of the curve or between the long end of the curve and the short end of the curve.
Although yield curve inversions signal recession, yields are too low for the curve to invert.
Yield Curve 3-Months to 5-Years

Curiously, there was a very tiny inversion between between 6-months and 1-year on February 2. On that date the yield on one year treasuries was less than the yield on 6-month treasuries.
The amount was not even a full basis point (0.01 percentage points). The above chart shows they touched.
If the Fed hikes twice, I would expect portions of the short end of the curve to invert.
Yield Curve Spreads
- 3-month to 6-month spread: 12 basis points
- 6-month to 1-year spread: 14 basis points
- 1-year to 2-year spread: 21 basis points
- 2-year to 3-year spread: 12 basis points
- 3-year to 5-year spread: 28 basis points
Even one hike of 25 basis points could cause an inversion. If the Fed does hike twice, I would expect multiple inversions. The likely places are the 6-month to 1-year spread and the 2-year to 3-year spread.
Mike “Mish” Shedlock