
by Mish
April housing starts came in at 1.172 million Seasonally Adjusted Annualized (SAAR), were well under the Econoday consensus estimate of 1.256.
March was also revised lower from 1.215 million to 1.203 million.
A topping out from lower-than-indicated expansion highs is the news from the April housing starts report where levels, though still healthy, are disappointing. Starts fell 2.6 percent to a 1.172 million annualized rate that is well below Econoday’s low estimate for 1.215 million. Downward revisions are a factor in the report, totaling 27,000 in the prior two months.
The strength in the report is in the key single-family component with starts up 0.4 percent to a rate of 835,000. Otherwise, however, the report is filled with minus signs. Permits for single-family homes fell 4.5 percent to a 789,000 rate with completions also down 4.5 percent, to 784,000.
The sharpest weakness comes from multi-family homes where starts fell 9.2 percent to a 337,000 rate. Permits did rise 1.4 percent to 440,000 but completions dropped 17.2 percent to a 322,000 rate.
April was supposed to be a rebound month for the economy. It was for the jobs report but bounces in last week’s retail sales and consumer price reports were minimal with today’s report an outright negative for the second quarter. Still most housing data, especially sales, have been showing significant strength going into the spring sales season.
April Permits, Starts, Slip from March Levels
Mortgage News Daily reports April Permits, Starts, Slip from March Levels
Permits for privately owned housing units were at a seasonally adjusted annual rate of 1,229,000 units, a decline of 2.5 percent from the estimated 1,260,000 permits issued in March. Analysts polled by Econoday had expected permits to be much higher, a range of 1,255,000 to 1,290,000, with a consensus of 1,271,000. Permitting for the month did remain above the annual rate of 1,163,000 in April 2016, an increase of 5.7 percent.
Housing starts in April were at a seasonally adjusted annual rate of 1,172,000 units, a 2.6 percent decline from March. The original March estimate of 1,215,000 starts was revised down to an annual rate of 1,203,000. The April estimate was 0.7 percent higher than the estimate a year earlier of 1,164,000.
Analysts were way wide of the mark. They expected starts to be in the range of 1,215,000 to 1,290,000. Their consensus was 1,256,000
Completions were at a seasonally adjusted rate of 1,106,000, 8.6 percent below the estimated 1,210,000 rate in March but 15.1 percent higher than in April 2016. Single family completions, at 784,000, represented a loss of 4.5 percent for the month but were up 10.1 percent year-over-year. While multi-family completions were up by 24.6 percent from a year earlier, to an annual rate of 299,000 units, they lost 19.8 percent compared to March.
Starts, Permits, Completions Detail

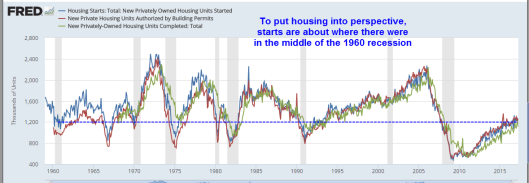
Compared to prior years dating all the way to 1960, these are exceptionally poor recovery numbers. Moreover, a deceleration in growth since 2014 is pretty clear.
Weather-Related Effects
Following first-quarter construction numbers, GDPNow posted a second-quarter GDP estimate to 4.3%. I proposed it would not last and was weather related.
4.3% Really?
In Investigating Weather-Related Effects on Construction Spending I posted this chart that explains the jump in the initial GDPNow forecast.
I asked Pat Higgins, creator of GDPNow if he could plug in construction revisions into his model to see what impact that would have on GDPNow.
Unfortunately, that was not possible.
Reply from Pat Higgins
Hi Mish,
I can’t answer your question about the revision of the first quarter based on the revision to the construction numbers because I’m not exactly sure how the Bureau of Economic Analysis handles these after an annual construction spending revision.
In particular, fourth quarter GDP isn’t scheduled to be revised until July 28th. But the construction spending numbers were revised back to 2015 with the annual revision.
If you look at the values of the construction spending values in the BEA’s Key Source Data and Assumptions Table, you’ll see that the construction spending numbers for January and February are denoted as estimates as subject to revision and the March estimate are denoted as assumptions for missing values for source data. I assume they mean subject to revision in the second and third GDP release. The October through December values are not denoted as either of these although these values were revised after the GDP report. So I’m not exactly sure how the BEA will handle the January–March construction spending data given that fourth quarter GDP won’t be revised until July 28th. You might want to contact the BEA about this.
Just speaking generally, the second quarter growth rate for a particular monthly indicator will approximately equal a weighted average of its February through June growth rates where the weight on the February growth weight is (1/9) and the weight on the March growth rate is (2/9). So revisions to February (or March) growth rates do matter for the model’s second quarter forecasts.
I can’t give my personal view on second quarter growth. In this macroblog article – Can Two Wrongs Make a Right? I provided a table with some summary statistics about the performance of the model 11 weeks before the first GDP release. And we have some calculations in the tab Track Record of our Excel File. The average absolute forecast error of the model 85 days before the release has been about 1.15 percentage points historically in real time since 2011:Q3. Hope this helps.
Pat
Once again, I thank Pat Higgins for generously answering all my questions as best he can.
Weather-Related Effects Part Two
The above graphic from today’s Residential Construction Report by the BEA.
How much of those strong numbers in January and February were related to good weather?
Here is an interesting paragraph from Can Two Wrongs Make a Right?
A closer look at the chart also reveals that GDPNow has had a tendency to overestimate the contribution of business fixed investment to growth and underestimate the growth contribution of inventory investment. Although these subcomponent biases have nearly offset one another on average, we really don’t want to have to rely on “Saint Offset.” We would like the subcomponent forecasts to be reasonably accurate because the subcomponents of GDP are of interest in their own right.
Add in extremely volatile construction spending reports that are nearly useless, then top that off with huge seasonal factors, and you get strange things like 4.3% GDP estimates.
Weather-Related Jobs
As noted previously, economists were quick to point out the bounce in the April Job’s report (see April Payrolls Bounce, Revisions Take March Lower: Hiring Increasingly Volatile). I commented …
Today’s establishment employment report shows a huge, 211,000 jump in reported jobs vs a downward revised March. The BLS revised March even lower, to 79,000 from 98,000. Revisions also took February up to 232,000 from 219,000.
Last month, economists blamed the weather. If so, the correct thing to do is average both months as employees not hired in March due to weather would have been hired in April instead.
The two-month average is 145,000 per month. That’s not a disaster, but it’s not particularly strong either.
I repeat my assertion that if March was primarily weather-related, then the job bounce in April should have been much stronger.
In addition to other flaws, it appears economists do not even understand simple averaging.
It will take a couple more jobs reports to determine is March was an aberration or the start of a slowdown. Regardless, April was not as strong as widely touted.
Think Outside the Model
It’s best to think outside the model when screwy reports come pouring in.
For further discussion, please see Tracking GDPNow Forecasts vs. Reality: What About that Initial 2nd Quarter Estimate?
I expected second-quarter GDP estimates would sink after this dismal report. They didn’t, yet. The GDPNow forecast rose.
Mike “Mish” Shedlock