
In it’s latest report, the Black Knight Mortgage Monitor confuses affordability with payment stress and fails to make an apples-to-apples comparison when determining homes are “more affordable” today than in the period 1995-2003.
Nonetheless, the report is interesting for what it does show. I am passing on a number of suggestion to them as to how to make the report better.
Mortgage Monitor Bullet Points
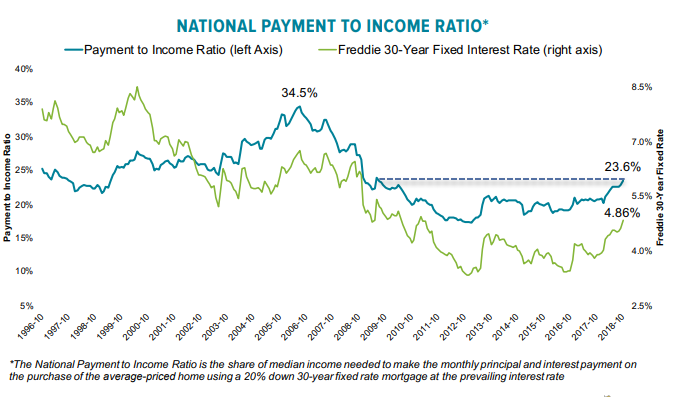
- It now takes 23.6% of median income to make the monthly payment on the average-priced home, making housing the least affordable it’s been in nearly a decade.
- The monthly principal and interest payment needed to purchase the average-priced home has seen a $190 per month increase since the beginning of 2018, an 18% jump.
- Despite the recent tightening, housing on average across the U.S. remains more affordable than the long term benchmark (1995–2003) of 25.1%.
- Even if home prices were to stay flat, another 0.50% increase in interest rates would make homes less affordable than long term norms.
California Least Affordable

- California is the least affordable state in which to live, requiring 39% of the median income in the state to purchase the average-priced home.
- Even more noteworthy is the increasing delta between affordability today and California’s own long-term averages.
- It currently requires 7.5% more of the median income to purchase the average-priced California home today (39.3% vs. 31.8%) that it did from 1995-2003.
- While that payment-to-income ratio is still far more affordable than the 59% peak in 2006, symptoms of California’s tight affordability environment appear to be emerging.
Affordability Today vs Historical Average
- 7 of the 10 states that are now less affordable than long-term averages have seen their rate of home price growth slow over the past six months.
- At the start of 2018, just two states – California and Hawaii – were less affordable than their long-term norms.
- As of today, 10 states have passed those benchmarks and another six are within 1.0% of long-term affordability levels.
- Hawaii is the least affordable state compared to long-term norms, requiring nearly 8% more of median income to make the payment on the average home than long-term averages.
Interesting but Flawed
The stats are interesting but there are a number of fundamental flaws in the reporting.
Median income and payments should be compared to median home prices, preferably by metro-area, but minimally by state.
A few charts will highlight the issues.
Real Median Income vs Sales Price Nationally
Real Median Income in California vs Sales Price in Western Region
I do not have payment data but the decline in interest rates will not offset the rise in home prices.
My charts are flawed as well. I used new home prices even though existing home prices would be a better fit because Fred history on existing sales only dates to September of 2017.
Let’s try one more thing.
Real Median Income vs Case-Shiller 20-City Index
Understanding Affordability
To understand where affordability really is, Black Knight needs to look at real median household income vs home prices of repeat sales of the same house.
Real median household income has been flat. Home prices sure haven’t been.
It’s the net of rising real incomes vs price (not payment) on the same house that determines whether or not homes are more affordable.
Using nominal wages to calculate “affordability” is a mistake. The CPI is hugely understated because it does not include home prices.
Those in school or paying for their own medical insurance would also dispute the CPI.
And what about rising property taxes?
Affordability vs Payment Stress
Consider a person who bought a house 20 years ago with a 30-year mortgage and refinanced lower three times without pulling any cash out.
Such a house is not more affordable today in any realistic sense even though payments by the original homeowner are less.
That person has more money to spend (and less mortgage payment stress), not because incomes are up, but because their payment fell (assuming property taxes did not rise too rapidly).
Similarly, a person in a variable rate mortgage in a rising rate environment has more payment stress while there is less payment stress in a falling rate environment.
In this sense, Black Knight also confuses affordability with decreasing mortgage stress on existing homeowners.
Addendum
Real Estate Decoded provided an Inflation-Adjusted – Case-Shiller Home Price Index
Compare the following charts to the Black Knight statement: “Despite the recent tightening, housing on average across the U.S. remains more affordable than the long term benchmark (1995–2003) of 25.1%.“
Inflation Adjusted Case Shiller USA
Inflation Adjusted Case Shiller 20 Cities + USA
Click on either chart to expand.
Real median household incomes have been stagnant. Real home prices haven’t.
Lower mortgage payments of existing homeowners do not make homes more affordable.
The Fed blew another housing bubble. Once again, the size of the bubble varies city to city.
I would be very interested in another take on this by Black Knight along the lines suggested above.
Related Articles
- California Ground Zero in Upcoming Real Estate Bust
- Thud! Sept New Home Sales Plunge 5.5% from Dramatically Revised Lower August
- Housing Continues to Weaken: Starts Decline 5.3%, Permits Down 0.6%
Mike “Mish” Shedlock


The lack of affordability is why the country’s largest homebuilder just posted tepid numbers for the latest quarter on LOWER average prices.
I’m at about 35%, and even upkeep on a condo is considerable, I could be close to 40% after special assessments and maintenance. I do have room for a boarder, and I really should have one. Still, I would actually buy stuff if it wasn’t for the expense of saving for the lol, coming impossibility of retirement.
One would think the staisticians would realize that if housing prices inflate on average 6% YOY and income rises 2-3% YOY affordability decrease with every passing year. New home prices in MI have inflated dramatically over the past 4-5 years and I wonder why people pay those inflated prices. I am thinking its because payments are affordable via fed induced interest rate suppression.
It could be Canada, where 50% of one’s income is spent on unaffordable housing:
Repeat endlessly
How to have affordable housing:
Deport 20 million illegals
The government stops guaranteeing any mortgages – as opposed to guaranteeing nearly all mortgages today.
Force banks to eat their bad loans.
Reinstatement of Glass-Steagall
Enforce GAAP and fraud laws. Throw bankers in jail for violations.
It’s amusing that you’re able to spell out the problem, yet constantly shill for people who have no intention of ever going after bankers. Not only that, they would happily stand in solidarity with the bankers against the likes of you and be completely convinced they’re right to do so.
How many candidates up for election tomorrow would carry out these steps? Probably zero.
It is amusing the echo bubble you live in.
The choice was DJT vs Hillary in 2016. And you could find no differences.
You probably can’t see any differences in the midterms.
“Republicans have been the primary advocates for winding down the two mortgage guarantors, so those efforts may get a boost under the new administration and Congress.”
It probably causes you some embarrassment that three red teamers conspired to repeal Glass-Steagall. Phil Gramm in particular would dress you down for even suggesting there’s anything wrong with banks today, but he would have ample company on the red side.
Then you link to an article from September 2016 that admits in the introduction that they’re not sure what Trump means for mortgage rates because he hadn’t said much about them. Seriously, the best you can do to promote the midterms is an article from the middle of the last election cycle?
By your own list of fixes, even you have to admit that Donald and the R’s have no intention of ever carrying out steps 3-5 (and would go to war with anyone who did), and have done very little on 1 and 2. Ironically, you and I are on the same side advocating that voting doesn’t matter, only you don’t seem to realize it.
This is the problem. There should be no govt mortgage guarantees, no interest rate deduction and normal interest rates. All of these have caused housing prices to soar. No politician has the integrity to do the right thing and the fed should not be determining interest rates.
You missed red tape and regulation. California has the most expensive “soft costs” to build a house (taxes, permit costs, other fees). Where before you even go vertical you have a big cost. California could help to lower housing with making it easier and cheaper to build. Also, we need more factory built homes in the US to drive down the costs.
The important ones, which have time and time again demonstratively lowered prices in every field where they have been tried, are:
2)End central banking altogether. Tomorrow. And I can guarantee you houses will be cheaper as soon as two days from now. This will solve your points 2-5 by default, with no fuzz whatsoever.
For F’s sake, stop the idiocy of taxing economic activity! Even someone as economically illiterate as as Bernie, can be heard parroting the truism that those things you tax, you get less of….It’s that obvious.
Then, to fund government, tax land. As land is pretty much the one thing that won’t disappear into space no matter how highly you tax it (extra credit for figuring out what makes land so special…..)…. Hence, given that taxing it begets less of it, “less” can only mean less cost in that particular instance.
So, you’ll have less costly land, no restrictions on garment industry levels of competition driving construction costs down…. Now what do you think that would do to the cost of housing?
Never mind the effect of zero sales and income taxes, zero “tax compliance” costs etc., on people’s ability to afford paying for a house…
Supply and demand. The 1+1=2 of economics.
If California is the most expensive place to live, then it must be the best place to live – otherwise it would be cheap like anywhere else. And remember, this is on top of the higher income taxes Californians pay.
It’s the money. I came out here from the Midwest, and make 4x what I could back home. I live a minimalist lifestyle, and am banking serious cash. Flyoverlanders that slam Californians forget that most of us came from flyover land. We came out here to secure our future.
Just remember that the midwest (well, Colorado is more “west” than midwest) is filling up with your former neighbors. And they’re bringing along their tax and tax and tax some more political views with them.
CA helps keep supply artificially low with anti-building “NIMBY-ism” and high costs and long time periods to get land permitted to build.
So then New Jersey must be paradise?
While fantastic weather obviously does increase CA desirability; in financialized dystopias; how close one is to the money printers (along several dimensions, geographically being one of them), trumps all.
The incentive to buy a home was essentially done away with by the new tax code. Millenials and others have no incentive go buy even if they have the money. Additionally owning a home restricts mobility. Expect more walk aways the next recession and bad loans on the books of banks for years.
Thanks to Wagner for the link
“Here is an example of how “Inflation-Adjusted – Case-Shiller Home Price Index ” looks like”
That’s a nice chart – Thanks
Note the Black Knight Statement – “Despite the recent tightening, housing on average across the U.S. remains more affordable than the long term benchmark (1995–2003)”
Uhhh… I don’t think so. Will add an addendum
The “Real Median Income” is inflation adjusted, but is the “Case-Shiller 20-City Index” inflation adjusted?
Here is an example of how “Inflation-Adjusted – Case-Shiller Home Price Index
” looks like –
Nice graphs. If the zero-point were Jan 1995, it would appear from the inflation-adjusted graph that there are 4 distinct periods:
Pre ’95
95-09
09-13
13-today.
Interesting. Like, what happened at the beginning of 1995 and 2013?
Are those “real” house prices being compared to “real” income? Or are those charts also apples to oranges?