
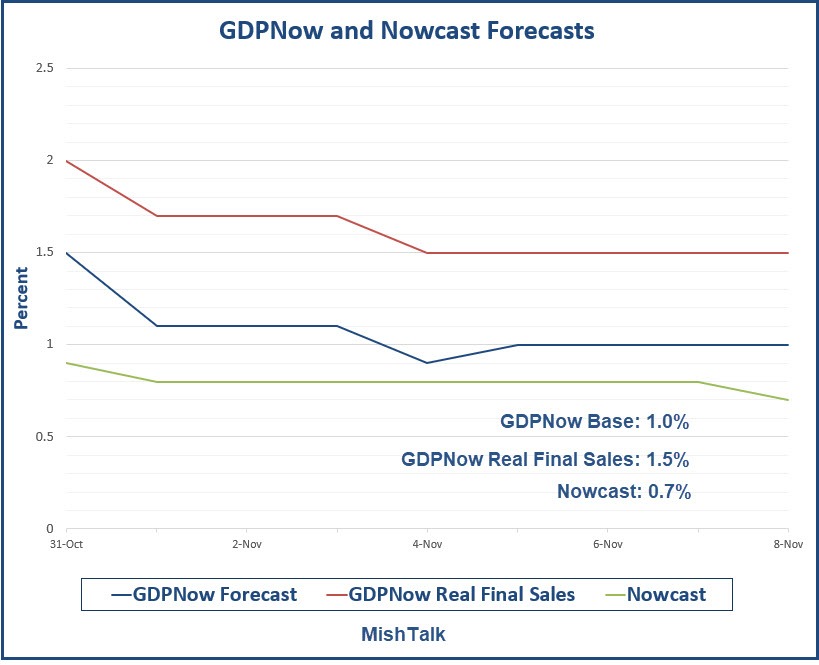
The 4th-quarter GDPNow and Nowcast forecasts start off on a weak footing, 1% or less.
The saving grace for GDPNow is its estimate of Real Final Sales, the true bottom-line measure of the economy. The rest is inventory adjustment which nets to zero over time.
Thus, GDPNow sees Change in Private Inventories (CIPI) as subtracting 0.5 percentage points from GDP.
The Nowcast report does not break out CIPI.
Mike “Mish” Shedlock
GDP growth rates by state in the USA take nominal state GDP growth rates and subtract CPI (or some other national average)… but the cost of living varies widely around the country, as do the changes in cost of living (aka “inflation”). Most everyone knows this, except perhaps@Casual_Observer
Since CPI understates inflation in high cost areas like Califorinia, the “real” (after inflation) growth rates for CA are overstated (real GDP growth is lower than reported). In the same way, inflation in lower cost areas is below CPI, which means the real growth rates in low cost areas are understated.
Pretty sure Mish, like milllions of others, figured this out since he is moving from high cost Chicago to lower cost Utah. I left high cost New York City a few years back, and moved to a much lower cost locale.
No mess here bob. We have more people moving into our region of california and it has a cost of index living of 100 (average for country) and unemployment below 3%. Unlike New York City, California cant be painted with a broad brush. You actually lived in NYC ? That would be like living in San Francisco or LA. Turns out your decisions have been worse.
And real GDP includes subtracting inflation. To get the actual gross geowth number you would have to add back inflation.
The other problem with your sorry analysis is you only think in extremes ( high and low). There are more places with average cost of living then high or low. Your extreme thinking clouds your judgement in all matters and it shows here.
The other funny part is if you had to move to a low cost locale you must have failed to make money in NYC. I dont know why you go to extremes. Too high or too low there ain’t no in between for country bumpkin bob.
You also fail to recognize I moved here in 2009 at the bottom of the cycle. It’s not like moving here at the top of a cycle which explains why you had to run away from NYC to the sticks. Dont you know anything about economic cycles country bob? Once again you fail with your simple thinking!
It also figures that you are so obsessed with GDP etc. There are people who are average and people who do way better irrespective if economic cycles. Are you even in the top 1% of incomes ? I’ve been there since 2009 and my income continues to rise way beyond any cost of living adjustment.
Your both dense and dumb bob. CPI is a positive number. You cant subtract it from any low cost areas as there is always inflation in a boom cycle. You have to live in a place where the economy is in recession to get a negative CPI.
Time to go to school bob. I posted a map of REAL GDP by state not nominal. Once again you’ve managed to top your own incomprehension.
HA HA HA HA HA HA!!!!
Eight separate replies over at least an hour.
The map you posted is nominal GDP minus CPI ==> real GDP.
Since CPI understates cost of living / inflation in high cost places like your sh!t hole 3rd world state, the correct state CPI would be greater and your sh!t hole state’s real GDP lower — DUH!!!
Since other parts of the country have lower costs and lower inflation, our state CPI is lower, meaning our real GDP is higher.
Sorry your math ability is so poor. Then again, I wouldn’t expect much from a person who moves INTO California
You have a comprehension problem. The map I posted says real GDP. I also posted the CPI numbers from each region of the country which has to be added back to get actual growth (not including inflation). I wouldnt expect any less someone who failed in NYC and had to move to a cheaper location to make ends meet.
8 posts is nothing. You’ve been run off this blog multiple times and the next time is coming Bob.
Continuing to argue with an imbecile would be almost as dumb as moving INTO California, and for that reason I am out
Dont let the door hit you on the way out.
Nothing says dead rotting economy moar than printing forty plus trillion dollars in a single year to drive wait for it ………………….1-1.5 % GDP,lol!
Nobody believes any numbers coming out of this White House anymore
Mish are these country bumpkin GDP numbers where you arbitrarily add or subtract inflation to your liking ?
True? False? Convince me… Steve Moore: Trump economy is really experiencing a middle-class boom — this data doesn’t lie link to foxbusiness.com
The Faux piece says…. median household incomes under Donald Trump have soared from $61,000 to an all-time high of $66,000 in less than three years into the Trump presidency. This is tremendous news and documents substantial middle-class prosperity in Trump’s first three years in office.
The Sentier research summary says….New data from the monthly Current Population Survey (CPS), indicate that median annual household income in August 2019 was $65,976, up $857 or 1.3 percent from July 2019 ($65,119). The median is now 6.8 percent higher than the median of $61,772 in January 2000, the
beginning of this statistical series.
Notice that the Faux piece mis-states that the rise from 61,000 was all during Trumps term, but the $61,772 actually was in 2000. So the rise was over 19 years, not 3.
Inflation has been conservatively 2% per year during the same period. That is about 6% overall compared to an 8% income gain overall in the same period. It is the treadmill effect of increased growth.
Steve Moore is a hack with accounting tricks…median US household income 2007 was $61,200, and was $61,900 in 2018.
Such a boom, right?
what could go wrong? Reporter’s notebook: Fog the mirror mortgages are back
With 35% down, you don’t need tax returns, income stated on the application or debt ratio calculations. link to ocregister.com
35% is better than the 3% average during the 2000s when all you needed was stated income and stated assets.
Sometimes not even that, in the case of NINJA loans
The national average GDP growth rate is a meaningless number, and the economics PhDs have been getting it wrong now for years anyway.
GDP growth in some sectors is MUCH higher than 2%. And in other areas, it is much lower. It is not a normal distribution, so taking the average is misleading at best.
When the advertising companies and newspapers scaled back (or shut down), and a lot of advertising shifted to (mostly) Google… total GDP didn’t change. It just moved. Did Google grow enough (in jobs, revenue, etc) to offset job losses etc at the NY Times and WaPo? To offset the shrinkage at Saatchi and Saatchi or Grey Advertising?
A lot of IPO based zombie companies (not just WeDontWork) are imploding. A lot of companies that supply to the shale oil farce (Caterpillar) are in deep trouble. But many other sectors are doing just fine.
Everyone focused on the national average is going to have a bad read (both directions)
Just as I had predicted many months ago. The hit from the tax cut has worn off. We are headed into the decade of 1/1/1 – 1% growth, 1% inflation and 1% rates.
How often are the forecasts right? I don’t think the’re much better than throwing darts with more chances to hit between 1 and 2 than any other number.
And imagine what GDP growth would look like if the stock market wasn’t “magically” up 23%+ year-to-date. The tail wagging the dog.
It is up because of cheap money.
Imagine the carnage in the stock market if just Warren Buffett, Bill Gates and Jeff Bezos are forced to liquidate 20% of their holdings to pay Pochohantis’ wealth confiscation…
That is just three sellers, dumping upwards of $70 billion in stocks overnight… with no US buyers (because all the other billionaires would be selling also).
“Little Gulp”
For his ludicrous ban on big drinks.
Bloomberg banned large soda drinks!!! I forgot about that one.
It was one of many absurd nanny-state policies ex-mayor Bloomie shoved onto NYC.
Meanwhile Bloomberg (the company) had free snacks — jolt cola, regular coca cola, boxes and boxes of candy, ramen noodle soup, and 6 pieces of fruit for 400 people. But hey! The offices have lots of salt water fish tanks to help the staff release stress… well it might if they were allowed to look at the fish.
The new offices have ID badges so they can track when the staff are in the bathroom or looking at the fish tanks… versus at their desks. Must be fun to justify bathroom breaks during annual reviews!
“Mini-Mike”
Most of the nicknames Wall Street has for Nanny Mike cannot be shown here because they would be censored by the blog host. They are not flattering, and quite a few are just nasty. Bloomberg terminal is (was?) the only show in town for awhile, but it now has competition in both analytics and secured IM’ing (MSG is the #1 function on Bloomberg by leaps and bounds). Saying the Bloomie (the information terminal) is popular is a half truth, extrapolating it to suggest Bloomberg the man is popular, even on Wall Street, is simply not true.
Bloomberg (the man) was essentially kicked out of Solomon Bros when it was a partnership (they put him “in charge” of IT to get him to quit).
I was surprised so many commenters (on the other post) suggested Bloomberg would have Wall Street’s support…. obviously those commenters do not and never did work on Wall Street.
Bloomberg’s own staff advised him not to run a few months ago, not unlike the assessment of current NYC mayor DeBlasio — who already dropped out of the 2020 race. Both should have listened to their own staffs
I wonder if there is a function on Bloomberg terminal for figuring out how many Bloomberg employees would get fired if Pochohantis gets her banana republic wealth confiscation idea passed?
Most (almost all?) of Nanny-Mike’s wealth is tied up in Bloomberg LP… so he (and all the billionaires) would have to sell ~20% of “his” company to fund Pochohantis’ spending spree. Who does he sell to? The other billionaires would be selling also, so Nanny Mike would be forced to sell to a foreign entity… and/or lay off enough staff to fund the confiscation.
Warren Buffett has almost all his wealth in Berkshire stock… does he dump it to pay confiscation? How many people at Berkshire subsidiaries get fired as a result?
Bill Gates says he favors wealth confiscation… but does he take money out of the Bill / Melinda Gates Foundation, or is a family trust an easy way to evade the confiscation? Does that mean all the other wealthy familes can avoid confiscation simply by putting assets into a trust?
What about tax evasion vehicles like the Clinton Foundation? Do they pay 20% also? What about all the foundations owned and operated by Hollwood “elite”? Do they pay 20% of their own wealth, or 20% including the assets in their foundations?
And who do all these people sell to? China? Russia? Saudi Arabia? Europe needs money, so they won’t be buying.
Do China and Russia end up buying 20% of the US in a fire sale? (everyone would have to sell quickly, so prices will go way down)
Pochohantis’ plan is just plain stupid. If she gets the Dem nomination, all the wealthy Dems are going to panic — many of them are already.
Biden will be lucky to avoid jail as the impeachment farce drags on. He will have to call in all his chips to keep his son out of jail too.
“The 4th-quarter GDPNow and Nowcast forecasts start off on a weak footing, 1% or less.”
…
Interested to see how housing holds up Q4.
August saw long end of yield curve tank 60 bps (most of that since erased). How many fencesitters et al jumped and locked in which drove activity for September (and lesser degree October)? Put me down for a slew of “unexpectedly” poor housing numbers thru year’s end.
Good observation Tony
10-year UST yield up more than 40 bps in the past 5 weeks. That’s gonna leave a mark….
No problem. The Fed has further to cut come 2020. My prediction was that in 2020 we would be at 1%. We are nearly there. The economy will also slowdown further due to impeachment proceedings and uncertainty. Expect mass layoffs to increase in 2020. People can watch the disaster from their couch instead of the office.