
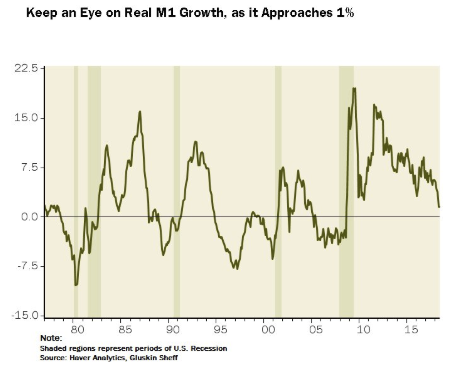
An Eye on M1
All of the monetary aggregates have slowed substantially, and real M1 growth is flagging a 1% stall-speed growth economy once we get passed all the pre-tariff buying activity and fiscal sugar-high that skewed Q2 GDP. pic.twitter.com/Nvxoae76sH
— David Rosenberg (@EconguyRosie) August 14, 2018
The problem with this story is that it does not match the hype. Nor does M2.
Real M1 and M2


Watching M1 is Useless
If we are supposed to keep an eye on M1, it sure is not clear why. The dashed lines above so instances in which M1 growth turned negative and nothing happened for years.
I also added M2. It’s equally useless.
Watching these monetary aggregates seems downright silly.
Cyclicals vs. Defensives
Seeking Alpha says Cyclicals Vs. Defensives (Aka The Market’s Achilles’ Heel).

The chart shows the cyclicals vs. defensives relative performance line against the S&P500. The key point is that cyclicals drove the last leg of the bull market, hence why I say this is basically the market’s Achilles’ heel.
The cyclicals vs. defensives line takes the ratio of the equal weighted performance of cyclicals (materials, industrials, technology) vs. defensives (telecoms, utilities, healthcare). As this line seems to trend during the study period, I have added a linear trend line for analytical purposes (the indicator is stretched vs. trend also).
As you can see on the chart, it’s been the solid performance of cyclicals relative to defensives that drove the last leg of the bull market. The extreme runup in the cyclicals vs. defensives relative performance line can unwind in one of two ways: 1. A bullish rotation: where the S&P 500 heads higher but defensive sectors take the lead; or 2. A bearish rotation: where the S&P 500 undergoes a correction/bear market, and defensives simply fall less than cyclicals.
Much, of course, will depend on the path of the economy, and I’ve previously shown how cyclicals vs. defensives tracks the ISM manufacturing PMI. So I think it’s fair to say that this is going to be a key indicator to watch from a risk management and market timing perspective.
The above chart makes far more sense than watching M1 (but so does watching a monkey throw rocks at the moon). Yet, the timing is clearly problematic, even if the thesis has merit. Let’s move along.
Junk Bonds
Please consider Junk Bond 12-Month Divergence Matter This Time?

I added the solid red line and the red box. There was a huge divergence in 2015 that did not amount to much. But the warning was accurate. There was a pullback in stocks and stocks did blast higher when junk bonds recovered.
If junk bonds remains weak, the stock market is highly likely to follow.
Watching junk bonds is an idea I have stated many times over the years. The above chart highlights the setup nicely.
Mike “Mish” Shedlock
You don’t use m1, you use “total checkable deposits”. Then you apply the distributed lag effect, which has been a mathematical constant for > 100 years.
Economic prognostications are infallible. And secular strangulation is a math formula, one that explains the fallacious accounting. It was predicted in 1961.
Nobody talks about the velocity of circulation. It’s one of the most important determinants of economic growth.
And nobody understands the mechanics of money velocity either.
It is not income velocity, Vi, it is a transactions concept, Vt. The transactions velocity, Vt, is an “independent” exogenous force acting on prices.
Most of this “S-Curve” dynamic damage (sigmoid function), was done by the first half of 1981, with the widespread introduction of new negotiable demand drafts, e.g., the effervescent “saturation value” of ATS, NOW, and MMDA accounts.
Thus, began secular strangulation. The decline in money velocity is identifiable. It is particularly traceable to the decline in savings put back to work (that produces financial perpetual motion). This is due to the preponderance of bank-held savings, funds that are un-used and un-spent, lost to both consumption and investment. Why? Because from the standpoint of the entire economy, the DFIs always create new money whenever they lend/invest. They do not loan out existing deposits saved or otherwise.
That is the error in Keynes’ General Theory. In almost every instance in which Keynes wrote the term bank in the General Theory, it is necessary to substitute the term financial intermediary in order to make his statement correct.
Velocity is pure idiocy
Mish, isn’t your dismissal of monetary aggregates a sin in the temple of Austrian Economics? You risk disbarment, surely!
The Austrians don’t know money from mud pie.
Although my own definition mentions money supply, It’s important to note that credit dwarfs money supply.
As for M1 and the above comment on “check deposits”, both are hugely distorted by Sweeps, something I have commented on before.
Finally, QE has so distorted everything that I wonder if anything but credit matters.
Simon Ward at Money Moves Markets is the top banana at economic forecasting, he has real narrow money slowing rapidly across the world, even the US too. Achtung.
“I added the solid red line and the red box. There was a huge divergence in 2015 that did not amount to much.”
The thing about indicators, is that under certain conditions they don’t work. Everything is reaching an extreme. An extreme amount of U.S. corporate cash was sitting overseas. With Trump unexpectedly winning, a large amount of it was repatriated. More stock buybacks. The SNB was busy in the second quarter, buying major U.S. tech stocks, helping push the Nasdaq to new highs in 2018. The U.S. stock market is becoming a safe haven for those in an unstable EU.
Narrow aggregates (M1) are crucially important over longer terms. They are what underpins the financialization racket we’re currently suffering through. Were it not for M1 growth since the 70s, much of the theft and redistribution to the financial racketeers that has been THE characteristic feature of the Ango world since then, would not be possible.
The very reason M1 doesn’t seem to matter much day to day, is that insiders can create higher order money at much, much lower risk; once The Fed has established that it stands ready to bail the whole broad money financialization pyramid out, with whatever narrow money creation is necessary, to keep the racketeers from suffering too badly. Thus preventing The System of theft, redistribution and racketeering from collapsing, which it, absent M1 expansion, would have, a long time ago.
Once The Fed has established that they WILL create enough M1 to bail out anything, no matter how much is needed; they can generally sit back and let their favored welfare recipients in the nominal “private” sector do the day to day creation of broader money. Only stepping in to prevent the system from collapsing, on the occasions where those guys run up credit card bills even their ever more generous welfare checks can’t quite cover.
Whatever the FED does, works until it doesn’t. Bernanke didn’t save the country or the world, he just pushed a collapse further into the future. The FED cannot change the laws of math and economics.
“Whatever it takes” will not solve the problem. It adds to the problem.
Global debt is now some 247 trillion dollars. That number is a few weeks old, so the amount is even higher.
This is exactly it. Even with rates at historical lows there is still a limit on the amount of debt that can be serviced. Right now we have increasing debt service costs heading to a meeting with (still) increasing levels of debt.
“Cyclicals driving the New Bull market”
247 trillion dollars in global debt driving the new bull market. The Swiss National Bank owns $87 billion of stock. Add in the Bank of Japan. The FED leveraged its balance sheet, to what, 4 trillion? The bull market started when FASB was told to allow banks to lie about the value of their assets. It is making the roaring 1920’s market look like a Sunday picnic. Of coarse, what spawned that bull market brought us the the Great Depression.
Elephant in the room. Interest rates became the lowest in 5,000 years. 5,000 years ago was 3,000 B.C. In other words, the lowest interest rates since the beginning of civilization. The EU has had negative rates and worked themselves into a corner. They allegedly can’t end QE or their bond market collapses. The BOJ is doing something similar. Every time China pulls its foot off the gas, it panics and steps on it again.
But that which cannot continue, at some point won’t. We are approaching the length of the longest U.S. economic expansion on record. Even if we exceed that this time around, time is slowly running out.
Makes sense. During slowdowns, the companies in bad shape are the first to show distress.