
Steady gains continue in the Case-Shiller Home Price Indexes.
Case-Shiller Year-Over-Year Summary
- The National Home Price NSA Index reported a 6.2% annual gain in October, up from 6.1% in the previous month.
- The 10-City Composite annual increase came in at 6.0%, up from 5.7% the previous month.
- The 20-City Composite posted a 6.4% year-over-year gain, up from 6.2% the previous month.
- Seattle, Las Vegas, and San Diego reported the highest year-over-year gains among the 20 cities. In October, Seattle led the way with a 12.7% year-over-year price increase, followed by Las Vegas with a 10.2% increase, and San Diego with an 8.1% increase.
Nine cities reported greater price increases in the year ending October 2017 versus the year ending September 2017.
Case-Shiller Month-Over-Month Summary
- Before seasonal adjustment, the National Index, 10-City and 20-City Composites all posted a month-over-month gain of 0.2% in October.
- After seasonal adjustment, the National Index, 10-City and 20-City Composites all recorded a 0.7% month-over-month increase in October.
- Eleven of 20 cities reported increases in October before seasonal adjustment, while all 20 cities reported increases after seasonal adjustment.
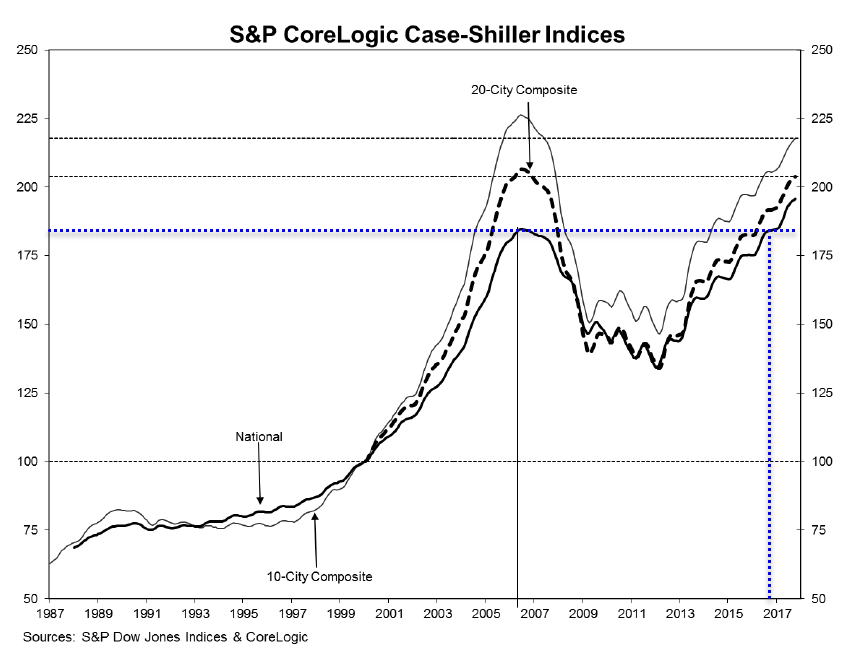
Peaks and Troughs

- The national index is 6.0% above the previous peak in July of 2006.
- The 20-city index is 1.3% below the June 2006 peak.
- The 10-city index is 3.8% below the June 2006 peak.
Congratulations
The Fed re-blew the housing bubble.
In the misguided way in which the Fed calculates inflation, none of this is considered inflationary.
Few new buyers can afford to buy.
Related Articles
- New Home Sales Spike Most in 25 Years: What’s Going On?
- Wealth Effect Propels Existing Home Sales: Up Most in 11 Years
Mike “Mish” Shedlock
@nic9075 Don’t leave us in suspense, is PITI higher or lower? Is that good or bad? I imagine you’re mentioning this because the monthly mortgage payment is pretty low because of the artificially low mortgage interest rate. Or is it really high because of higher taxes? Or is it about the same because the the monthly payment is actually a mix of different contributors?
what does this look like adjusted for inflation?
and what about rents since 2006?? they have surged especially in the NYC area, but in the suburbs rent have gone parabolic
You cannot talk about home prices without mentioning the actual PAYMENT people are making now compared to 2006.. somehow the total PITI payment is never men
tioned..
22% inflation since 2006, still way off peak in real terms. But it does help the people who bought and the bankers who lent at the peak.