
by Mish
The Huffington post reports “The new law will boost paychecks for millions of California workers. More than 40% of California workers earn less than $15 dollars an hour. ”
The very next line, written by Peter Dreier, professor of politics at Occidental College is economic nonsense: “By putting more money in people’s pockets, the pay increase will improve the economy by increasing consumer spending in businesses throughout the state.”
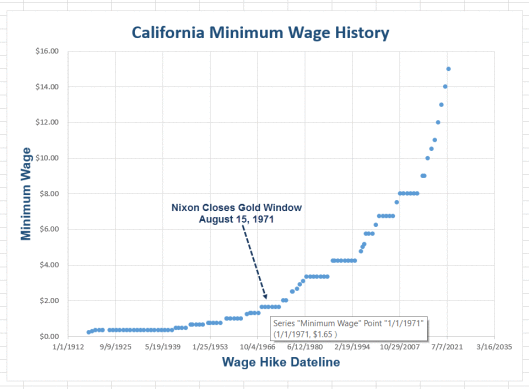
Inquiring minds just may be interest in seeing a chart of California minimum wages hikes over time, all the way back to 1912. I just happen to have that chart.
California Wage Hike History
Data for the above chart is from the California Department of Industrial Relations, History of California Wage Hikes.
Data points through 2022 reflect the new wage hikes.
The idea for this post comes from reader “Rand” who emailed the links and a Google Docs chart. I re-entered the data into Excel.
As for Peter Dreier’s ridiculous comment, the only things thing this hike is guaranteed to do are as follows
- Make the US more uncompetitive
- Increase the use of robots
- Drive up prices
- Crucify those on fixed incomes
- Hammer cities with increased costs of doing routine maintenance
Where does it stop? Please look at my chart and tell me. Then tell me why we should not expect another round of outsourcing and increased use of robots.
Mike “Mish” Shedlock