
The New York Fed Survey of Consumer Expectations shows “Consumers’ Expectations Largely Stable; while Home Price Growth Expectations Continue to Retreat”.
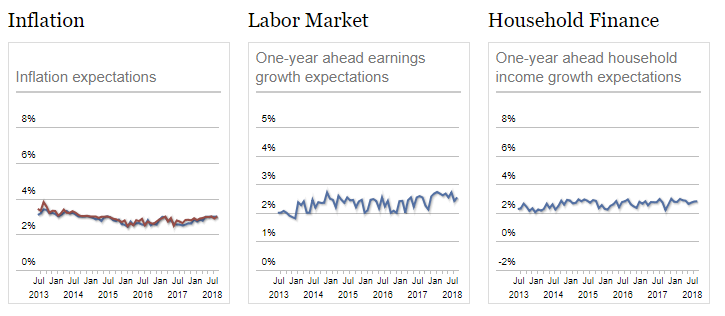
>Year-ahead inflation expectations remained steady at 3.0 percent over the month while three-year-ahead expectations ticked up by 0.1 point to 3.0 percent. Expectations about household income and spending growth were stable at 2.8 percent and 3.2 percent, respectively. Home price growth expectations retreated by 0.1 point to 3.6 percent since July, while expectations about the growth in government debt rose sharply to 7.9 percent, up from 6.9 percent in the prior month, marking the highest such reading since November 2015.
One can download the survey data and create better-looking charts. Here are a few charts I created.
One Year Ahead Household Income Projections

One Year Ahead Household Inflation Projections

One Year Ahead Household Spending Projections

Income Synopsis
25 Percent Level: 0.92% Income Increase
Median: 2.81% Income Increase
75 Percent Level: 5.88% Income Increase
Inflation Synopsis
- 25 Percent Level: 1.28% Inflation Increase
- Median: 3.00% Spending Inflation Increase
- 75 Percent Level: 5.08% Inflation Increase
Spending Synopsis
25 Percent Level: 0.69% Spending Increase
Median: 3.15% Spending Increase
75 Percent Level: 8.28% Spending Increase
Assumptions
- The 25% level on inflation expectations may not be the same set of people as the 25% level on spending and income.
- The spending and income levels are highly likely to be better correlated.
Conclusions
Assuming assumption number two is correct, low end seems desperate to hold the line on spending while expecting low income growth.
The median household expects to spend a little more than they take in, and very near the median inflation exception as well.
Those at the high end expect to spend much more than they make, despite expecting a hefty 5.88% income jump. This group is likely counting on continued asset price gains.
Mike “Mish” Shedlock
“expectations about the growth in government debt rose sharply to 7.9 percent” – What does it even mean? Do normal people follow the deficits closely to come up with ‘expectations’ on government debt? Garbage in, garbage out.
The question as always in any type of poll result is — How was the sample chosen?
Most of the people I meet would likely say that many things they buy are getting more expensive — rent, food, fuel, even iPhones. How do they put a number to that? The small number who pay attention to government propaganda know that the consensus of the global Political Class is that 2% per annum inflation is good for us (somehow!), and that might influence their estimate in the well-known phenomenon of “anchoring”.
But does this have any real predictive value for future consumer behavior – in a world in which so many people are living paycheck to paycheck?
Markets laughin at QT!Fed tightening lol,tough act to try and pretend to tighen at the same time quietly printing tens of trillions and handing it off to straw buyers to buy netflix and amazon!Which means dow will continue straight up ONLY as long as central banks continue to print like it’s 1999!
A divergence between inflation expectations and the 10yr US bond yield over the past 2 years. While yield have gone from 1.3% to 3.1% expectations keep falling. This would indicate yields are rising due to default fears rather than actual inflation.
I am not sure if 10yr bond yield is determined by market forces or dictated by the FED nowadays. Most countries (e.g. Japan, EU, China) no longer have market-based government bond yields. They are dictated by the central banks.