
by Mish
It turns out the source for Breitbart 2% revision claim comes from analysis of state data by “Ironman” at Political Calculations.
“Ironman” pinged me with an update based on the fact the BEA will release its estimates in pieces, even though it makes little practical sense to do so.
Revised Political Calculations Estimate
Please consider An Unexpected Sneak Peek of a Massive Downward GDP Revision for the U.S.?
Update 16 June 2016: We were contacted by one of our readers who pays close attention to the BEA’s revisions of GDP. Apparently, the BEA’s plans for the revision of the national level GDP data will only cover the period from 2013-Q1 through 2016-Q1.
That’s really weird. It’s a lot harder for the BEA to disentangle the state level contributions by industry from their national level source data, but once it’s done, it means that they’ve also updated and revised the national level data per all the most recently available information. It just doesn’t make sense to sit on that much revised data and not update the national level figures to reflect the entire scope of all the revision work that has been done.
What that means is that there will very likely be an ongoing discrepancy between the state-level GDP and its rollup to the national level, and the BEA’s reported national level data. The two datasets should largely match, except for that contribution by U.S. contractors who support U.S. military operations overseas, which falls outside the economic activity that occurs within the 50 states and the District of Columbia as noted by the BEA, and which should only represent a very small fractional contribution to the national GDP figures above the aggregate rollup of state level GDP for the 50 states and Washington DC.
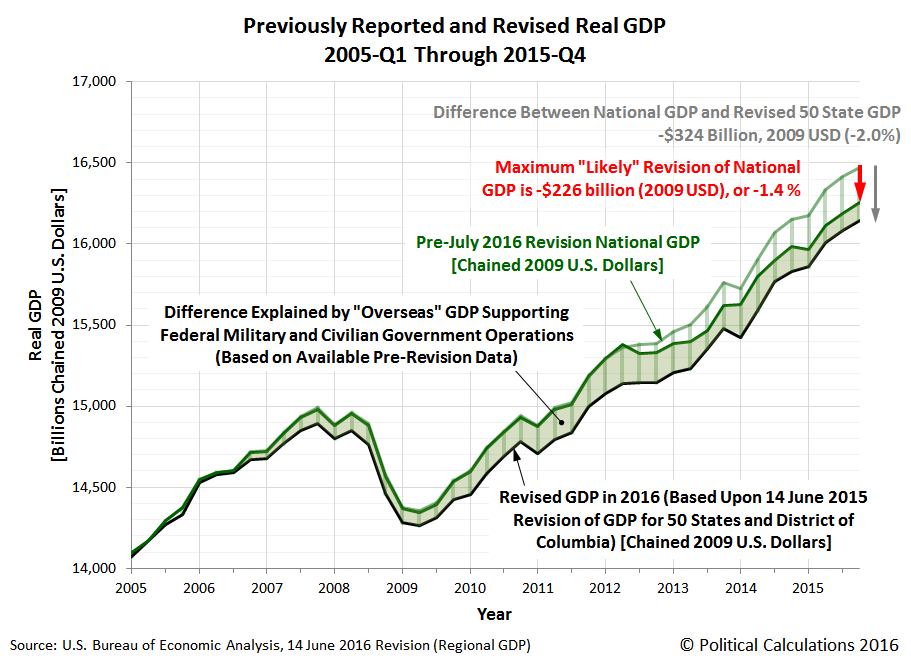
Update 18 June 2016, 6:20 PM EDT: We’ve been working behind the scenes with other competent econobloggers to sort out just how big the BEA’s upcoming national level GDP revision will be when it is finally posted in the last week of July 2016. In doing that, we’ve estimated just how big the contribution to national GDP is for federal military and civilian activity located overseas, based on the available pre-revision data we have to estimate that figure through 2015-Q3. The chart below shows that contribution and updates our findings:
We project that the maximum “likely” size of the upcoming revision for national GDP is -1.4%. We expect it will actually be less than that figure because the upcoming national GDP revision will only cover the period from 2013-Q1 through 2016-Q1, which will therefore not fully address the discrepancy that begins appearing after 2012-Q2.
It is also possible that the federal military and civilian activity located overseas will turn out to be significantly larger than what the BEA’s data has previously indicated, which would also narrow the gap between how national GDP is currently being reported and what the just-revised aggregate state GDP suggests it will turn out to be.
This is really pretty cool because this is the first time that this kind of predictive exercise has even been possible thanks to the BEA’s more timely reporting of its regional GDP data series. As our long time readers know, we’re very happy whenever we’re both on the cutting edge of doing new analysis and can share our work in progress in developing a brand new kind of analysis to get to the real story behind the numbers in the economy.
Revisions on Top of Revisions
We have revisions on top of revisions, all done piecemeal even though “It just doesn’t make sense to sit on that much revised data and not update the national level figures to reflect the entire scope of all the revision work that has been done.”
Well, there are reasons. What makes “practical” sense and what makes “political” sense are two different things.
For political purposes ahead of the election, it makes perfect sense to minimize the GDP downgrades.
It’s quite possible GDP goes up more in 2014 than it declines in 2015 due to construction spending.
My analysis focuses on construction spending revisions going back 11 years (see January 5, 2016 in Diving Into the Revisions: Construction Spending Revised Lower 7 Consecutive Months! 2015 GDP Will Decline vs. Estimates: By How Much?)
I have no confidence in any set of numbers, including my own, but I do have faith in one thing.
Piecemeal GDP Revisions July 29: I have faith the revisions are timed to make things look as good as possible for Obama.
— Mike “Mish” Shedlock (@MishGEA) June 19, 2016
Addendum from “Ironman”
We’ve corrected the chart at our original post to fix a minor error, to correctly indicate that the date of the BEA’s revision of its 50 state + Washington DC GDP data is 14 June 2016 (not 2015).
Some additional back of the envelope numbers – the BEA’s July 2016 revision of the national level real GDP data will be about $54-55 billion (constant 2009 USD) smaller than what we’ve indicated the maximum “likely” revision to be. This discrepancy will be directly attributable to the BEA’s plans to only revise national level data from 2013-Q1 through 2016-Q1 in its annual July revision exercise.
Assuming that the contribution to GDP from overseas federal military and civilian government activities (mostly arising from U.S. contractors working to support the U.S. military’s operations in both Iraq and Afghanistan) is not itself revised from what the BEA’s pre-revision data indicates, that puts the “most likely” revision at -1.1% of the pre-July 2016 revision national real GDP level through 2015-Q4.
If the size of that “overseas” contribution to U.S. national GDP is adjusted upward, the overall revision will be smaller, and if that contribution is adjusted downward, the overall negative revision to national GDP will be larger. How much that will be revised and in which direction will depend upon the extent to which the BEA’s national revision may re-attribute GDP that was previously reported as being part of the 50 state + DC contribution to instead be included in the contribution of overseas federal military and civilian government activities to national GDP.
Perhaps the most interesting takeaway in our analysis is that 2012-Q3 now appears to have been a negative real economic growth quarter, which of course was followed by the nearly-zero growth quarter of 2012-Q4. Given the scope of the BEA’s planned national level revision, that is something that will not be evident in the data the BEA will be reporting.
Check out that last paragraph. It’s possible there was a small recession in 2012 Q3 – 2012 Q4.
Mike “Mish” Shedlock