
I now have enough GDPNow Data Points for the second quarter to display a chart.
Those used to amazing volatility may now be amazed by amazing non-volatility, especially in the real final sales estimate.
On April 30, in Here We Go Again: GDPNow Projects 4.1% GDP, I posted this comment from Pat Higgins, the creator of GDPNow.
Today’s update incorporates modifications to GDPNow’s dynamic factor model as described here. [Mish Note: the dynamic factor model is for economic geeks only].
The dynamic factor is used to forecast yet-to-be-released monthly GDP source data. The modifications to the factor model are intended to partially dampen some of the volatility in GDPNow forecasts in the early part of each month.
Well, that change seemed to work volatility-wise, but is the number necessarily better?
Consider this snip from today.
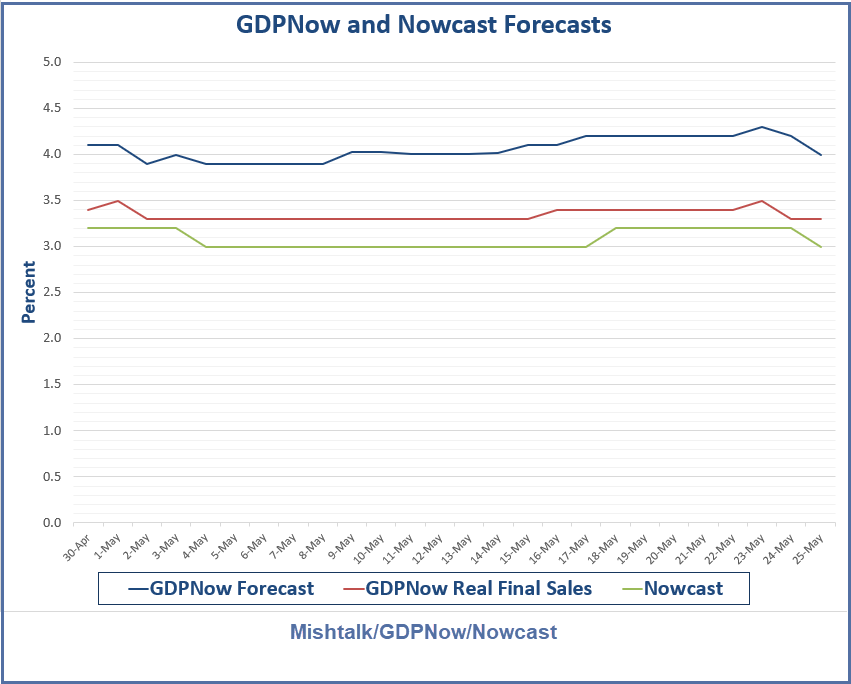
Latest forecast: 4.0 percent — May 25, 2018
The GDPNow model estimate for real GDP growth (seasonally adjusted annual rate) in the second quarter of 2018 is 4.0 percent on May 25, down from 4.1 percent on May 16. After increasing from 3.3 percent to 5.4 percent following Wednesday’s reports on new-home sales and costs from the U.S. Census Bureau, the nowcast of second-quarter real residential investment growth fell back down to 1.1 percent following Thursday’s existing-home sales release from the National Association of Realtors.
We get another test at the beginning of June.
Meanwhile, I suggest 4.0% is quite on the high side.
Mike “Mish” Shedlock
Maybe Higgins should stick to balsa wood airplane models!
Maybe they have a new metric system of interest rates that they ain’t telling us about.