
Please consider U.S. Housing-Market Trends Suggest Recession Around Election Time, 2020.
> Ten years ago, in September 2008, plunging home prices pushed Lehman Brothers into bankruptcy, fueling a financial crisis that sent the United States, and much of the world, into a deep recession.
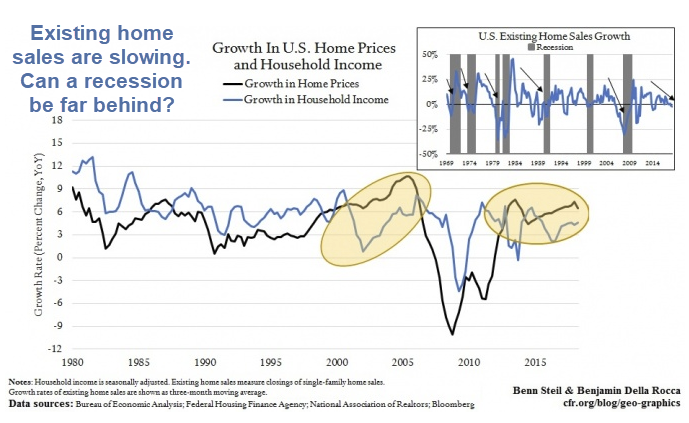
> One metric that signaled trouble in the years leading up to the crisis was an expanding gap between the growth in home prices and household income—as shown in the left-hand shaded circle above. When income can’t keep pace with home prices, the latter must come down. Overleveraged home “owners” default on their mortgages, creating a housing glut that drags prices down further. Falling home values slow consumer spending, and therefore GDP growth, by way of the so-called wealth effect—that is, consumers cut spending when their assets fall in value. In the United States, according to one [Federal Reserve study](https://www.newyorkfed.org/medialibrary/media/research/economists/mccarthy/Housing_Activity_and_Consumer_Spending.pdf “Federal Reserve study”), consumption drops by $2.50-5.00 for every $100 decline in housing-market net worth.
> With the Federal Reserve in tightening mode, and mortgage rates headed up, there is good reason to expect this drop to continue. Assuming it does so on the pace it’s been on since 2015, home-sales growth will fall to levels accompanying prior recessions by the end of 2020—right around election time.
New Home Sales

New home sales are in a downtrend, but year-over-year sales of new homes do not show the same pattern as the feature chart.
New Home Sales Year-Over-Year

Both the new and existing series seem very noisy as any kind of recession predictor.
Unfortunately, the Fred existing home sales series only dates back one year or I would put year-over-year rates on the same chart to compare.
Sales of New vs Existing Homes
- New Homes: 627,000 SAAR
- Existing Homes: 5.34 million SAAR
SAAR stands for seasonally-adjusted-annualized-rate, in simple terms an estimated one-year total at the current seasonally-adjusted rate.
While new home sales are more of an indicator for family formation, existing home sales are far more important by volume.
And with every existing home sale comes appliance upgrades, new furniture, landscaping, kitchens, etc.
Leading Indicators
Starts or permits are considered the leading indicators. Let’s take a look.
Single-Family Starts vs Permits Year-Over-Year

The Fed is hiking and home prices are through the roof.
But close inspection shows existing home sales to be another noisy indicator.
Based on all of the above the charts, it’s difficult to say a recession is likely in 2020.
For many reasons, though, I doubt we make it that far.
I have been saying that for a long time, But that’s not an excuse to use charts that don’t quite make the case.
Mike “Mish” Shedlock
I would guess that the impact of the housing sector on overall economic activity is likely to have diminished in the post-bubble era. Mortgage credit growth was far more subdued in this cycle and builders and developers were more cautious, because initially there was such a big supply overhang from the previous boom.
The Achilles heel of this boom is corporate debt rather than mortgage debt; in my opinion the bust will be triggered by several of the most over-leveraged sectors running into trouble with servicing their debt as interest rates rise and excess liquidity is mopped up. That is particularly relevant for sectors that lack free cash flows (funny enough, the fracking industry seems to be one of them).
Two of the biggest and most solid drivers of the economy over the last several decades have been the housing and automobile manufacturing. New data shows that housing may be joining the auto sector in slowing. The article below looks at the ramifications of both these sectors slowing.
Those magic obama years. The insane bubble in housing is plain to see.
Rising interest rates + DJT new tax laws + the great QE unwind + Mel Watt retiring = the end of the housing bubble
Hey. How come when Mel Watt gets hit with a recent sexual harrassment and hostile workplace charge by one of his employees and it barely makes a blip in the paper? He will stay to the bitter end until January 2019.
No one can predict the timing, but another recession is inevitable. Home prices are through the roof and the financial system is still out of control. There are a number of lessons which should have been learned 10 years ago, but sadly were not. Rather than save the economy, those in power (Fed, Wall Street and their puppets in office) simply saved their own asses at the expense of U.S. taxpayers.
The recession will come when either Trump gets taken out and the Dems raise taxes and fees; or when the rising dollar and interest rates set off the sovereign debt contagion. Either way, 2020-2021 will be the latest.
Predictions are hard, especially about the future :0)