
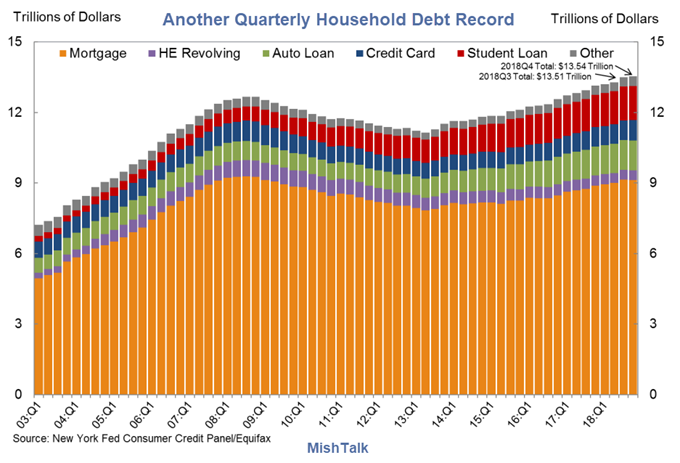
The New York Fed report on Household Debt and Credit Developments in 2018 Q4 shows consumer debt hit another new record.
Aggregate household debt balances ticked up in the fourth quarter of 2018 for the 18th consecutive quarter, and are now $869 billion (6.9%) higher than the previous (2008 Q3) peak of $12.68 trillion. As of December 31, 2018, total household indebtedness was $13.54 trillion, a $32 billion (0.2%) increase from the third quarter of 2018. Overall household debt is now 21.4% above the 2013 Q2 trough.
Mortgage balances shown on consumer credit reports on December 31 stood at $9.1 trillion, essentially unchanged from the third quarter of 2018. Balances on home equity lines of credit (HELOC) continued their declining trend from 2009 with a drop of $10 billion in the fourth quarter and are now at $412 billion, the lowest level seen in 14 years. Non-housing balances increased by $58 billion in the fourth quarter, with auto loans increasing by $9 billion, credit card balances going up by $26 billion, and student loan balances by $15 billion. The increase in credit card balances is consistent with seasonal patterns but marks the first time credit card balances re-touched the 2008 peak; card balances now stand at $870 billion.
Housing Debt
- There was $401 billion in newly originated mortgage debt in 2018 Q4.
- Mortgage delinquencies were flat again, with 1.1% of mortgage balances 90 or more days delinquent in 2018 Q3.
- Delinquency transition rates were mixed, with about 1.0% of current balances transitioning to delinquency. Transitions from early delinquency were flat, as 14.8% of mortgages in early delinquency (30-60 days late) transitioned to 90+ days delinquent. The share of mortgages in early delinquency that “cured” was 35.1%.
- About 68,000 individuals had a new foreclosure notation added to their credit reports between October 1 and December 31, up slightly the previous quarter. Foreclosures remain very low by historical standards.
Credit Cards, Account Closings, Credit Inquiries and Collection Accounts
- Transitions into serious delinquency for credit card accounts increased again. While this rate is highest for younger borrowers, it has risen sharply among older borrowers over the last two years.
- The number of credit inquiries within the past six months – an indicator of consumer credit demand – declined to the lowest level seen in the history of the data.
- Account closings were at their highest level since 2010.
Student Loans
- Outstanding student loan debt stood at 1.46 trillion in the fourth quarter, up $15 billion.
- 11.4% of aggregate student debt was 90+ days delinquent or in default in 2018 Q4, a small improvement from the jump seen in the third quarter of 2018. Transition rates into delinquency were unchanged.
Delinquencies by Loan Type

Credit Card Stress in Higher Age Groups

Delinquencies are rising despite the allegedly robust jobs market. Stress is not at 2008 levels but it has been on the upswing since 2014 or 2016 depending on the age group.
So what happens in a downturn?
Mike “Mish” Shedlock
Wouldn’t an increase in the dollar value of debt be consistent with the increase in the supply of money?
The Fed has created trillions of dollars, which is available to the banking institutions who only want to lend it out to someone to make money on the interest. If I’m wrong here, please let me know where, but it seems that the banks have excess trillions to lend to people.
With the low interest rates, it’s easy for a consumer to obtain a lot of debt. If interest rates were higher, the ability to accept and manage debt would be much harder/riskier.
So the Fed has effectively raised the limit to how much, in dollars, debt people can hold before they hit a critical tipping point in payments, all other things being held equal, by increasing the supply so much that the interest rates are subsequently very low in order to get that money loaned out.
The trick is to determine what is that tipping point and I think the delinquency rates speak to that.
This is certainly a healthier economy built on income and some debt compared to the last boom. But that wouldn’t be hard to top given how much everything was built on debt from 2002-2007.
Don’t worry, what households didn’t indulge in credit-wise since the last crisis, corporates and governments more than made up for.
Yep. The solution of the previous crisis are the seeds to the next crisis.
Household debt as a percentage of GDP has been falling since 2008 when it hit nearly 100. This chart from the St. Louis Fed only goes up to 2017, by which point the household debt was down to 80% of GDP.
link to fred.stlouisfed.org
It has fallen more slowly since then, and was down to 76.6% in the second quarter of 2018:
Looking at Mish’s charts above, the only debt that seems uncontrolled is Student debt. Here’s a chart through 2014, and it has continue to go up:
Isn’t this chart another way of seeing that the funny-numbers economy, represented by GDP, is (temporarily) hiding the actual financial deterioration of most Americans? The people enjoying those fat GDP gains are NOT the people going into debt for a college degree.
As I have pointed out, if you look at even the raw chart, total debt shrunk a lot after 2008, it has been climbing, but that climb is only happening in student debt and auto loans. If you look at the default rate chart, credit card defaults are inching higher, but still lower than at any time between 2003 and 2015. I just don’t see anything in these charts showing “the actual financial deterioration of most Americans”. I do see young people being stupid, and borrowing huge amounts that they many never be able to repay, but that’s a different problem.
Like I mentioned to the person above you… corporates and governments have more than made up for the modest increases in consumer debt.
You know what the problem is? Immigrants!!!
Hobgoblins from the other side of some arbitrary line on a map. No doubt about it. Those guys are obviously so darned wealthy, every one of them. Just by looking at them flauting their wealth outside home depot in the morning, it is obvious to all, that they are where all the wealth stolen from the middle classes went…..
That red line is just so glaring. How can the federal government ask U.S. citizens to pay back student loans, when illegal aliens and prisoners are receiving a free education?
Illegals have no money to steal. If you’re a robber, you go where there still is some money left.
What you see here is the Trump economic boom in full color. In 2008, some debts were written off and some credit was withdrawn (I had two of my credit cards lose some of the unused available credit) and that went on for a few years after 2008 as a graph shows. All that happened when Trump got elected was people started using a lot of restored credit which would inevitably hit the “acceptable maximum” and Trumps economic miracle would stop. Thats next.
Looking at the chart, I don’t see any significant growth in the balances on credit cards or home equity lines of credit.
You do see overall debt rising since 2012 tho right?
Assets are rising a lot faster than debt, net worth is through the roof.
That’s because the “assets” are nothing but paper claiming ownership to the debt. And pretending it’s all money good, hence implicitly overvaluing it.
Eyeballing the chart, it looks like all the growth in debt since 2008 is in two categories, auto loans and student debt. Student debt appears to have tripled in the last ten years. Factor in that the economy is larger now, and the other categories are all a smaller as a percentage of GDP than they were. Student debt also is the only one with a delinquency rate higher than a decade ago, while auto loans are flat. All the others have had declined over the last decade, though not over the last 4 years.