
At what point does something turn from a thud to a crash? I suggest right now.
Economists in the Econoday survey expected a small increase in housing starts building on a rise in November. Instead, the BEA revised November down and starts fell another 11.2% on top of that.
Housing starts proved unexpectedly weak in December and will pull back residential investment in Thursday’s GDP report. A strong offset, however, is steady strength in permits which are less impacted by weather or similar one-time effects.
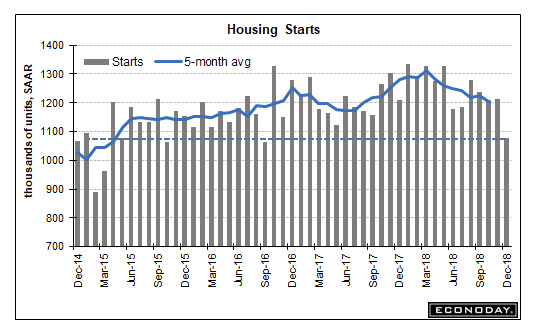
Starts fell 11.2 percent in the month to a 1.078 million rate that is far below Econoday’s consensus range. This compares with a long trend in the 1.200 to 1.300 million range and is the weakest showing since September 2016.
Wildfires in the West may be at play and are likely responsible at least in part for a 26.3 percent monthly drop in starts in the region to a 216,000 rate. But starts were also down 13.2 percent in the Midwest to a 125,000 rate with the South down 6.0 percent to 630,000. The Northeast was unchanged at 107,000.
Starts of single-family homes, down 6.7 percent, fell less severely than multi-units, down 20.4 percent. This should limit the pull lower for residential investment as single units have higher per unit construction costs than multi-units.
Now the good news in the report. Permits rose 0.3 percent in December to a 1.326 million rate that exceeds Econoday’s high estimate for 1.305 million. Here, however, the single-family reading is down 2.2 percent to 829,000 while multi units are up 4.9 percent to 497,000. And here the West shows strength, up 17.1 percent to 383,000.
Today’s report, a one that is truly mixed, points to trouble for immediate economic data — particularly fourth-quarter GDP — but also to building strength in coming data based on the strong showing for permits.
Truly Mixed?
It is absurd to call this a “mixed” report.
Permits do not necessarily turn into starts. There has to be buyers, and if there isn’t builders will be sitting on a ton of homes built on spec.
And permits for single-family starts, a sign of household formation were down. Future cheering is about apartment buildings.
Let’s dive into the Census Bureau New Residential Construction report for more details.
Starts, Permits, Completions

Housing Starts
Privately‐owned housing starts in December were at a seasonally adjusted annual rate of 1,078,000. This is 11.2 percent below the revised November estimate of 1,214,000 and is 10.9 percent below the December 2017 rate of 1,210,000. Single‐family housing starts in December were at a rate of 758,000; this is 6.7 percent below the revised November figure of 812,000. The December rate for units in buildings with five units or more was 302,000. An estimated 1,246,600 housing units were started in 2018. This is 3.6 percent above the 2017 figure of 1,203,000.
Building Permits
Privately‐owned housing units authorized by building permits in December were at a seasonally adjusted annual rate of 1,326,000. This is 0.3 percent above the revised November rate of 1,322,000 and is 0.5 percent above the December 2017 rate of 1,320,000. Single‐family authorizations in December were at a rate of 829,000; this is 2.2 percent below the revised November figure of 848,000. Authorizations of units in buildings with five units or more were at a rate of 460,000 in December. An estimated 1,310,700 housing units were authorized by building permits in 2018. This is 2.2 percent above the 2017 figure of 1,282,000.
Housing Completions
Privately‐owned housing completions in December were at a seasonally adjusted annual rate of 1,097,000. This is 2.7 percent below the revised November estimate of 1,128,000 and is 8.4 percent below the December 2017 rate of 1,197,000. Single‐family housing completions in December were at a rate of 790,000; this is 0.1 percent above the revised November rate of 789,000. The December rate for units in buildings with five units or more was 296,000. An estimated 1,191,700 housing units were completed in 2018. This is 3.4 percent above the 2017 figure of 1,152,900.
Incredibly Weak Rebound

For an economic expansion that is just months away from the longest on record, this has been one incredibly weak housing rebound. Population-adjusted numbers are far worse. We are at levels seen in the 1950s!
Mike “Mish” Shedlock
I live in a high priced housing county. Many are complaining about how much they owe in taxes. There’s a cap on mortgage interest now and it’s biting hard.
Fortunately my home is paid off.
Congrats on your home being paid off! Do you live in CA? What is the mortgage interest cap at?
Never mind the question regarding interest cap.
It’s not the mortgage interest cap but the SALT deductions capped at 10k. I could see a lot more people going to pass through economy in California and other high tax states to recoup this.
Financialization at work. Why build houses when you can be a rentier, take zero risk by borrowing money at a couple percent knowing the Fed has your back, outbid other housing buyers, and charge high rents? And the flip side is all the millennials who can’t get enough income coming in regularly to start a family partially because of the high rents.
Once again, an informative chart. During the housing expansion between 1990 and 2006, both categories grew until about 1998. At that point single family houses continued to grow while multifamily units flatlined. The amazing thing is the bubble echo out of the housing crash is showing a similar pattern of mutual growth followed by single family growth/ multi family flatline. The housing cycle is topping.
Is that the case across the country? I see a scenario where housing will do ok in low tax states but not in high tax states.
It has been incredibly weak, suggesting there has got to be an incredible backlog of potential demand.