
Initial Reaction
Today’s establishment survey shows jobs rose by 201,000. Revisions were negative.
The household report posted much weaker results than the establishment survey. The number employed fell by 423,000.
The unemployment rate, a household survey measure, was flat as the labor force declined by 469,000.
Nonfarm wage growth was +0.4%, the strongest aspect of the report.
Job Revisions
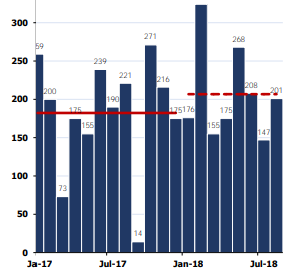
The change in total nonfarm payroll employment for June was revised down from +248,000 to +208,000, and the change for July was revised down from +157,000 to +147,000. With these revisions, employment gains in June and July combined were 50,000 less than previously reported. (Monthly revisions result from additional reports received from businesses and government agencies since the last published estimates and from the recalculation of seasonal factors.) After revisions, job gains have averaged 185,000 per month over the last 3 months.
Let’s dive into the details in the BLS Employment Situation Summary, unofficially called the Jobs Report.
BLS Jobs Statistics at a Glance
- Nonfarm Payroll: +201,000 – Establishment Survey
- Employment: -423,000 – Household Survey
- Unemployment: -46,000 – Household Survey
- Involuntary Part-Time Work: -188,000 – Household Survey
- Voluntary Part-Time Work: +249,000 – Household Survey
- Baseline Unemployment Rate: flat at 3.9% – Household Survey
- U-6 unemployment: -0.1 to 7.4% – Household Survey
- Civilian Non-institutional Population: +223,000
- Civilian Labor Force: -469,000 – Household Survey
- Not in Labor Force: +692,000 – Household Survey
- Participation Rate: -0.2 to 62.7– Household Survey
Employment Report Statement
Total nonfarm payroll employment increased by 213,000 in June, and the unemployment rate rose to 4.0 percent, the U.S. Bureau of Labor Statistics reported today. Job growth occurred in professional and business services, manufacturing, and health care, while retail trade lost jobs.
Unemployment Rate – Seasonally Adjusted

The above Unemployment Rate Chart is from the BLS. Click on the link for an interactive chart.
Nonfarm Employment Change from Previous Month by Job Type

Nonfarm Employment Change from Previous Month

Hours and Wages
Average weekly hours of all private employees was flat at 34.5 hours. Average weekly hours of all private service-providing employees was flat at 33.3 hours. Average weekly hours of manufacturers was steady at 41.0 hours.
Average Hourly Earnings of All Nonfarm Workers rose .10 to $27.16. That a 0.37% gain. Average hourly earnings of private service-providing employees rose $0.10 to $26.89, a gain of 0.37%. Average hourly earnings of manufacturers rose $0.06 to $27.08, a gain of 0.22%.
Average hourly earnings of Production and Supervisory Workers rose $0.07 to $22.73. That’s a 0.31% gain. Average hourly earnings of private service-providing employees rose $0.07 to $22.47, a gain of 0.31%. Average hourly earnings of manufacturers rose $0.04 to $21.47, a gain of 0.19%
Year-Over-Year Wage Growth
- All Nonfarm from $26.39 to $27.16, a gain of 2.9%
- All production and supervisory from $22.11 to $22.73, a gain of 2.8%.
Wage inflation remains benign.
For a discussion of income distribution, please see What’s “Really” Behind Gross Inequalities In Income Distribution?
Birth Death Model
Starting January 2014, I dropped the Birth/Death Model charts from this report. For those who follow the numbers, I retain this caution: Do not subtract the reported Birth-Death number from the reported headline number. That approach is statistically invalid. Should anything interesting arise in the Birth/Death numbers, I will comment further.
Table 15 BLS Alternative Measures of Unemployment

Table A-15 is where one can find a better approximation of what the unemployment rate really is.
Notice I said “better” approximation not to be confused with “good” approximation.
The official unemployment rate is 3.9%. However, if you start counting all the people who want a job but gave up, all the people with part-time jobs that want a full-time job, all the people who dropped off the unemployment rolls because their unemployment benefits ran out, etc., you get a closer picture of what the unemployment rate is. That number is in the last row labeled U-6.
U-6 is much higher at 7.4%. Both numbers would be way higher still, were it not for millions dropping out of the labor force over the past few years.
Some of those dropping out of the labor force retired because they wanted to retire. The rest is disability fraud, forced retirement, discouraged workers, and kids moving back home because they cannot find a job.
Strength is Relative
It’s important to put the jobs numbers into proper perspective.
- In the household survey, if you work as little as 1 hour a week, even selling trinkets on eBay, you are considered employed.
- In the household survey, if you work three part-time jobs, 12 hours each, the BLS considers you a full-time employee.
- In the payroll survey, three part-time jobs count as three jobs. The BLS attempts to factor this in, but they do not weed out duplicate Social Security numbers. The potential for double-counting jobs in the payroll survey is large.
Household Survey vs. Payroll Survey
The payroll survey (sometimes called the establishment survey) is the headline jobs number, generally released the first Friday of every month. It is based on employer reporting.
The household survey is a phone survey conducted by the BLS. It measures unemployment and many other factors.
If you work one hour, you are employed. If you don’t have a job and fail to look for one, you are not considered unemployed, rather, you drop out of the labor force.
Looking for jobs on Monster does not count as “looking for a job”. You need an actual interview or send out a resume.
These distortions artificially lower the unemployment rate, artificially boost full-time employment, and artificially increase the payroll jobs report every month.
Final Thoughts
Once again the household survey and the establishment survey diverge. Over time they tend to balance but at economic turns the household survey often leads.
Despite the alleged robust jobs picture, wage growth has been anemic. It jumped a bit this month but wages are not keeping up with inflation, especially for those in school, those seeking to buy a home, and those who buy their own health insurance.
Mike “Mish” Shedlock
So how do you resolve the differences between 200k jobs added and 400k fewer people employed? For every person who stopped working there was someone who started working 2 or 3 jobs?
Maybe it’s the seasonal adjustments. Summer time jobs disappearing.
This kind of analysis is what makes Mish’s website superior to the infotainment garbage offered on cable. This website is useful and informative while probing for truth and trying to capture reality as accurately as possible. CNBC? Nope.
I’m currently counted but have about 4 months left before I drop off the rolls. Life in your mid to late 40s is different potential employers look at you. I’m worth more dead than I am alive.
Hang in there Casual_Observer. I was recently in your shoes (a very “late 40’s engineer”), but finally found work and am in a better situation now compared to my last gig. However, I was not too much in a good mood while unemployed – to say the least! If I could have foreseen how it eventually has turned out, I doubt I would have believed it or I would have enjoyed the time off a lot more.
It is very hard once you are in your 40s (let alone 50s or 60s). The workforce as a whole is much younger than say 20 years ago (except for govt jobs).
Millenials I find have a hostile, combative and defensive attitude toward anyone that isn’t ‘exactly’ like them and then use confirmation bias for this deep seated hatred they have toward anyone who is not exactly like them. Age discrimination is widespread in most white collar jobs and even in ‘safe’ occupations like health care now.
not everyone will be as lucky as you are and then be able to have this positive attitude with false rose colored glasses. Sorry but “hope” and Positivity won’t get you a job let alone pay the bills
I can assure you that it gets worse the older you get. At your age you have time to reboot yourself. Get into a business where you either have control or strong employment guarantees. I have a buddy who recently gave up his position as chief mechanic at a car dealer where he was making 6 figures. Went to work for the city of SF. Took a cut in pay. But now he will have job security, a guaranteed pension, super benefits and ability to retire after just 15 years on the job when he will be in his early 60’s. Smart guy.