
Initial Reaction
The Econoday consensus was for a payroll expansion of 151,000 jobs. ADP forecast 156,000 jobs. The result slightly beat both estimates but revisions were negative.
Job Revisions
The change in total nonfarm payroll employment for May was revised down by 10,000 from +72,000 to +62,000, and the change for June was revised down by 31,000 from +224,000 to +193,000. With these revisions, employment gains in May and June combined were 41,000 less than previously reported. After revisions, job gains have averaged +140,000 per month over the last 3 months..
BLS Jobs Statistics at a Glance
- Nonfarm Payroll: +164,000 – Establishment Survey
- Employment: +283,000 – Household Survey
- Unemployment: +88,000 – Household Survey
- Involuntary Part-Time Work: -363,000 – Household Survey
- Voluntary Part-Time Work: -87,000 – Household Survey
- Baseline Unemployment Rate: 3.7% – Household Survey
- U-6 unemployment: down 0.2 to 7.0% – Household Survey
- Civilian Non-institutional Population: +188,000
- Civilian Labor Force: +370,000 – Household Survey
- Not in Labor Force: -183,000 – Household Survey
- Participation Rate: +0.1 to 63.0% – Household Survey
Employment Report Statement
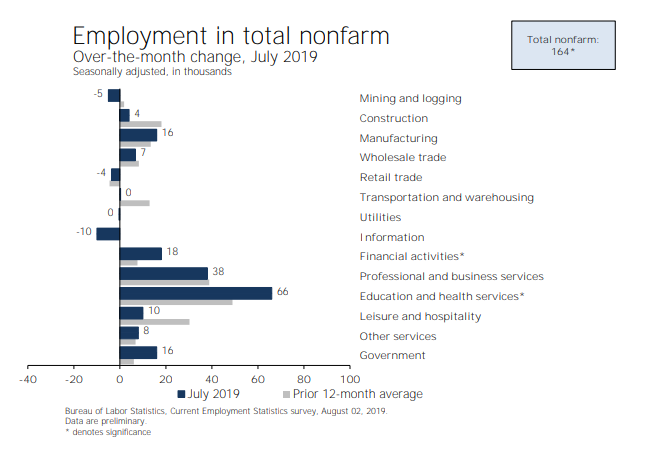
Total nonfarm payroll employment rose by 164,000 in July, and the unemployment rate was unchanged at 3.7 percent, the U.S. Bureau of Labor Statistics reported today. Notable job gains occurred in professional and technical services, health care, social assistance, and financial activities.
Unemployment Rate – Seasonally Adjusted

The above Unemployment Rate Chart is from the BLS. Click on the link for an interactive chart.
Nonfarm Employment Change from Previous Month

Hours and Wages
Average weekly hours of all private employees was down 0.1 hours to 34.3 hours. Average weekly hours of all private service-providing employees was flat at 33.2 hours. Average weekly hours of manufacturers fell 0.2 hours to 40.2 hours.
Average Hourly Earnings of All Nonfarm Workers rose $0.08 to $27.98. That a 0.29% gain. Average hourly earnings of private service-providing employees rose $0.09 to $27.74, a gain of 0.33%. Average hourly earnings of manufacturers rose $0.03 to $27.70, a gain of 0.11%.
Average hourly earnings of Production and Supervisory Workers rose $0.04 to $23.46. That’s a 0.17% gain. Average hourly earnings of private service-providing employees rose $0.05 to $23.19, a gain of 0.22%. Average hourly earnings of manufacturers rose $0.02 to $22.16 a gain of 0.23%
Year-Over-Year Wage Growth
- All Private Nonfarm from $27.11 to $27.98, a gain of 3.2%
- All production and supervisory from $22.71 to $23.46, a gain of 3.3%.
For a discussion of income distribution, please see What’s “Really” Behind Gross Inequalities In Income Distribution?
Birth Death Model
Starting January 2014, I dropped the Birth/Death Model charts from this report. For those who follow the numbers, I retain this caution: Do not subtract the reported Birth-Death number from the reported headline number. That approach is statistically invalid. Should anything interesting arise in the Birth/Death numbers, I will comment further.
Table 15 BLS Alternative Measures of Unemployment

Table A-15 is where one can find a better approximation of what the unemployment rate really is.
Notice I said “better” approximation not to be confused with “good” approximation.
The official unemployment rate is 3.7%. However, if you start counting all the people who want a job but gave up, all the people with part-time jobs that want a full-time job, all the people who dropped off the unemployment rolls because their unemployment benefits ran out, etc., you get a closer picture of what the unemployment rate is. That number is in the last row labeled U-6.
U-6 is much higher at 7.0%. Both numbers would be way higher still, were it not for millions dropping out of the labor force over the past few years.
Some of those dropping out of the labor force retired because they wanted to retire. The rest is disability fraud, forced retirement, discouraged workers, and kids moving back home because they cannot find a job.
Strength is Relative
It’s important to put the jobs numbers into proper perspective.
- In the household survey, if you work as little as 1 hour a week, even selling trinkets on eBay, you are considered employed.
- In the household survey, if you work three part-time jobs, 12 hours each, the BLS considers you a full-time employee.
- In the payroll survey, three part-time jobs count as three jobs. The BLS attempts to factor this in, but they do not weed out duplicate Social Security numbers. The potential for double-counting jobs in the payroll survey is large.
Household Survey vs. Payroll Survey
The payroll survey (sometimes called the establishment survey) is the headline jobs number, generally released the first Friday of every month. It is based on employer reporting.
The household survey is a phone survey conducted by the BLS. It measures unemployment and many other factors.
If you work one hour, you are employed. If you don’t have a job and fail to look for one, you are not considered unemployed, rather, you drop out of the labor force.
Looking for jobs on Monster does not count as “looking for a job”. You need an actual interview or send out a resume.
These distortions artificially lower the unemployment rate, artificially boost full-time employment, and artificially increase the payroll jobs report every month.
Final Thoughts
Job volatility remains high. Revisions continue to be negative. Hours fell slightly. Excluding January, job growth is clearly slowing.
Mike “Mish” Shedlock
I was wondering what took you so long. Its literally the same template with different numbers.
I don’t understand Mish?!?!? How can you go out in nature when the government is on recess?
Its like you think mother nature can exist without park rangers to tell her what to do.
/sarc
The latest I got out this report ever – dating to 2003 – as long as I have been blogging
No internet connection in Grand Canyon at the lodge. Internet at the campground kept dropping. Drove 45 mile to Jacob Lake – no WiFi here at all but was able to connect via phone hotspot – but slow