
Initial Reaction
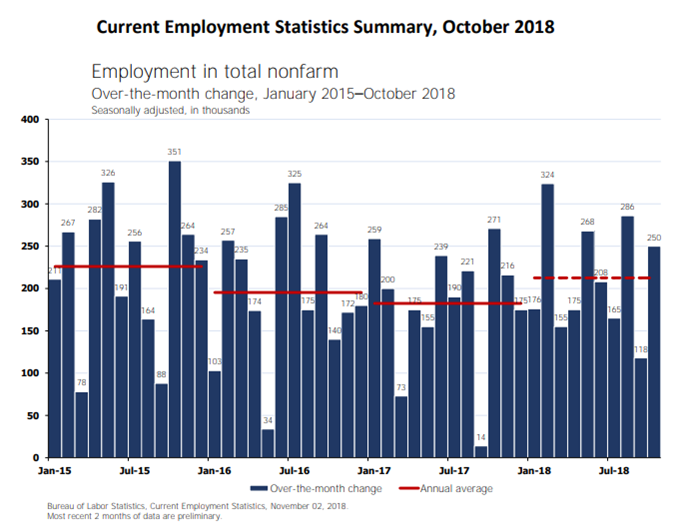
After revisions, job gains have averaged 218,000 over the past 3 months. That a solid set of numbers.
Let’s dive into the details in the BLS Employment Situation Summary, unofficially called the Jobs Report.
Job Revisions
The change in total nonfarm payroll employment for September was revised down from +134,000 to +118,000, and the change for August was revised up from +270,000 to +286,000. The downward revision in September offset the upward revision in August.
BLS Jobs Statistics at a Glance
- Nonfarm Payroll: +250,000 – Establishment Survey
- Employment: +600,000 – Household Survey
- Unemployment: +111,000 – Household Survey
- Involuntary Part-Time Work: -21,000 – Household Survey
- Voluntary Part-Time Work: -317,000 – Household Survey
- Baseline Unemployment Rate: steady at 3.7% – Household Survey
- U-6 unemployment: -0.1 to 7.4% – Household Survey
- Civilian Non-institutional Population: +224,000
- Civilian Labor Force: +711,000 – Household Survey
- Not in Labor Force: -487,000 – Household Survey
- Participation Rate: +0.2 to 62.9– Household Survey
Employment Report Statement
Total nonfarm payroll employment rose by 250,000 in October, and the unemployment rate was unchanged at 3.7 percent, the U.S. Bureau of Labor Statistics reported today. Job gains occurred in health care, in manufacturing, in construction, and in transportation and warehousing.
Unemployment Rate – Seasonally Adjusted

The above Unemployment Rate Chart is from the BLS. Click on the link for an interactive chart.
Nonfarm Employment Change from Previous Month by Job Type

Nonfarm Employment Change from Previous Month

Hours and Wages
Average weekly hours of all private employees was flat at 34.5 hours. Average weekly hours of all private service-providing employees was flat at 33.3 hours. Average weekly hours of manufacturers fell 0.1 hour at 38.8 hours.
Average Hourly Earnings of All Nonfarm Workers rose .05 to $27.30. That a 0.18% gain. Average hourly earnings of private service-providing employees rose $0.06 to $27.04, a gain of 0.22%. Average hourly earnings of manufacturers was flat at $27.11, a gain of 0.00%.
Average hourly earnings of Production and Supervisory Workers rose $0.07 to $22.89. That’s a 0.31% gain. Average hourly earnings of private service-providing employees rose $0.06 to $22.61, a gain of 0.27%. Average hourly earnings of manufacturers rose $0.07 to $21.68, a gain of 0.32%
Year-Over-Year Wage Growth
- All Private Nonfarm from $26.47 to $27.30, a gain of 3.1%
- All production and supervisory from $22.18 to $22.89, a gain of 3.2%.
Wage inflation remains benign.
For a discussion of income distribution, please see What’s “Really” Behind Gross Inequalities In Income Distribution?
Birth Death Model
Starting January 2014, I dropped the Birth/Death Model charts from this report. For those who follow the numbers, I retain this caution: Do not subtract the reported Birth-Death number from the reported headline number. That approach is statistically invalid. Should anything interesting arise in the Birth/Death numbers, I will comment further.
Table 15 BLS Alternative Measures of Unemployment

Table A-15 is where one can find a better approximation of what the unemployment rate really is.
Notice I said “better” approximation not to be confused with “good” approximation.
The official unemployment rate is 3.7%. However, if you start counting all the people who want a job but gave up, all the people with part-time jobs that want a full-time job, all the people who dropped off the unemployment rolls because their unemployment benefits ran out, etc., you get a closer picture of what the unemployment rate is. That number is in the last row labeled U-6.
U-6 is much higher at 7.4%. Both numbers would be way higher still, were it not for millions dropping out of the labor force over the past few years.
Some of those dropping out of the labor force retired because they wanted to retire. The rest is disability fraud, forced retirement, discouraged workers, and kids moving back home because they cannot find a job.
Strength is Relative
It’s important to put the jobs numbers into proper perspective.
- In the household survey, if you work as little as 1 hour a week, even selling trinkets on eBay, you are considered employed.
- In the household survey, if you work three part-time jobs, 12 hours each, the BLS considers you a full-time employee.
- In the payroll survey, three part-time jobs count as three jobs. The BLS attempts to factor this in, but they do not weed out duplicate Social Security numbers. The potential for double-counting jobs in the payroll survey is large.
Household Survey vs. Payroll Survey
The payroll survey (sometimes called the establishment survey) is the headline jobs number, generally released the first Friday of every month. It is based on employer reporting.
The household survey is a phone survey conducted by the BLS. It measures unemployment and many other factors.
If you work one hour, you are employed. If you don’t have a job and fail to look for one, you are not considered unemployed, rather, you drop out of the labor force.
Looking for jobs on Monster does not count as “looking for a job”. You need an actual interview or send out a resume.
These distortions artificially lower the unemployment rate, artificially boost full-time employment, and artificially increase the payroll jobs report every month.
Final Thoughts
Despite the alleged robust jobs picture, wage growth has been benign. Wages have not kept up with inflation, especially for those in school, those seeking to buy a home, and those who buy their own health insurance.
Mike “Mish” Shedlock
A former co-worker of mine has been looking for a new job since his contract ran out this past June. He responds to a couple ads that sound similar, but are in adjacent towns. He finds out different recruiters are posting for the same job. He has had several phone screens and a couple on-site interviews. What frustrates him the most is many of these jobs are contingent upon the company being awarded a major contract. The labor market may “better”, but statistics include double counting and mirages.
Hiring for high-tech positions, over the past decade it almost seems as if there is at least one gal whose job is “recruiter,” for every guy who they claim can do advanced stuff, like counting past ten.
And the same goes for “outsourcing.” At least one American woman attaching pictures of herself, skimpily dressed, in all communication; for every “certified this-or-that” dude in Bangalore she “represents,” who can “grow your business” or otherwise fulfill all your Powerpoint-talking-point dreams…
A big problem in tech is that a company, say, Intel, will advertise one job on their website. Often that job isn’t really a job at all, but is just a posting for immigration compliance purposes, ie: getting a H-1B a green card.
3rd party recruiters will replicate the same posting under their own branding. And post the same job to the job boards.
Thousands of applications will come in from interested people.
The “job” won’t ever be filled, but it will show up in the statistics as “20” job openings.
The “statistics” are nonsense. Even major STEM universities like UC Berkeley still can’t substantiate more than 1/3rd of their STEM graduates finding post-graduation STEM jobs in their fields. A situation with is most likely by far worse at other schools.
The better historical number is the employment to population ratio.
We are nowhere near boom times and just recovering. The numbers are similar to the early 1980s.
Colloqually the BLS is known as the “Bureau of Lies and Scams”.
But some numbers are so easily to calculate even they cant be manipulated.
The numbers have been so distorted that it’s impossible to compare current numbers with those of past decades. The numbers are a little better than in say 1999, but 1999 was a much better year to be a job seeker than now.
But, having said that the job market is clearly better than it was 2 years ago. Not sure if it will be enough for the GOP to hold the house, but the chances are going up.