
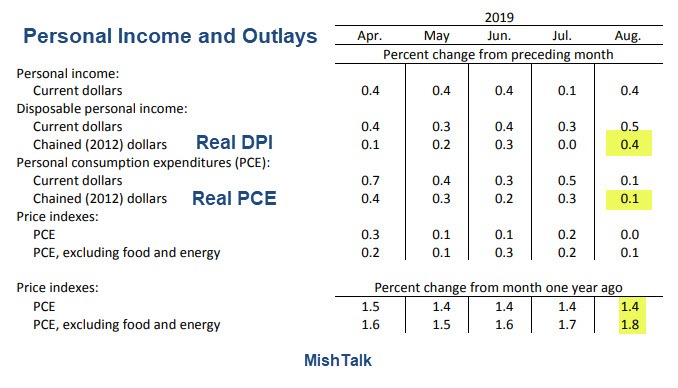
August Personal Income and Outlays
- Personal income increased $73.5 billion (0.4 percent)
- Disposable personal income (DPI) increased $77.7 billion (0.5 percent)
- Personal consumption expenditures (PCE) increased $20.1 billion (0.1 percent).
- Real DPI increased 0.4 percent in August and Real PCE increased 0.1 percent.
- The PCE price index increased less than 0.1 percent.
- Excluding food and energy, the PCE price index increased 0.1 percent.
The above synopsis from the BLS Personal Income and Outlays report for August.
July Revisions

The reports are nearly mirror images. In July real income was weak (0% growth) but spending was moderate (+0.3%) growth.
Mike “Mish” Shedlock
Only in ponzi-land would we have someone upset that people spent less than they earned.
If people added savings (or paid down debt), we should be celebrating.
If only we could get the criminals in Washington DC to cut their spending
Why the “But”?
Isn’t good news when incomes are rising faster than expenditures?
Should this have read “And”?
“Excluding food and energy, the PCE price index increased 0.1 percent.”
We need the added diversity of food and energy in order to have an inclusive PCE price index.
Adding up their monthly 2012-dollar numbers:
So over the last 2 months both income and spending are up 0.4%. Pretty perfect. GDP Estimates for 3rd quarter are now over 2%. Stock market holding steady.
Factset on S&P 500:
Earnings Growth: For Q3 2019, the estimated earnings decline for the S&P 500 is -3.8%. If -3.8% is the actual decline for
the quarter, it will mark the first time the index has reported three straight quarters of year-over-year earnings declines since
Q4 2015 through Q2 2016.
Earnings Revisions: On June 30, the estimated earnings decline for Q3 2019 was -0.6%. All eleven sectors have lower
growth rates today (compared to June 30) due to downward revisions to EPS estimates.
Personal income up $73.5 billion in August.
Fedgov deficit $200 billion in August.
Business as usual.
Watch this space closely for more on the fiasco in leveraged loans:
Earnings at leveraged loan issuers slump prompting more scrutiny for $1.2T market
Issuers of U.S. leveraged loans recently posted a second straight quarter of razor-thin earnings growth and decline in cash-flow coverage, as the business-cycle dashboard flashes warning signals regarding this longest-ever period of U.S. expansion.
The softening of key metrics is of particular concern to participants in the nearly $1.2 trillion leveraged loan space, which entails credits to riskier, speculative-grade borrowers. Over the past decade, the popularity of covenant-lite loans in this market has skyrocketed, while other investor protections traditionally found in leveraged loans have evaporated, amid intense investor demand.
“Excluding” blah blah blah. How can you exclude anything when it comes to reality ?