
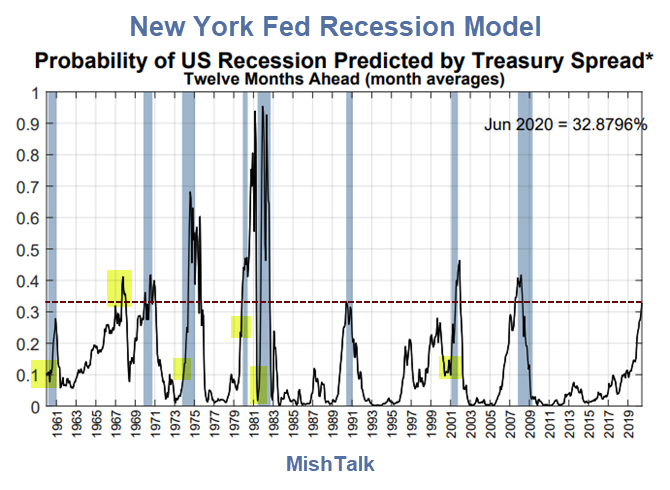
New York Fed Treasury Spread Model
The New York Fed Recession Model is based on yield curve inversions between the 10-year Treasury Note and the 3-Month Treasury Bill.
I added the highlights in yellow and the dashed red line.

The model uses monthly averages.
Smoothed Recession Odds

I do not know the makeup of the smoothed recession chart but it is clearly useless. The implied odds hover around zero, and are frequently under 20% even in the middle of recession.
GDP Recession Model

The GDP-based recession model is hugely lagging. The current estimate is 2.4%. This model will not spike until there is at least one quarter of negative or near-zero GDP.
Estimated Recession Probabilities

Predicting Recessions
The above chart is from the Yield Curve as a Predictor of U.S. Recessions by Arturo Estrella and Frederic S. Mishkin. It is from 1996 so the table may have been revised.
Practical Issues
One might also wish to consider the 2006 discussion the Yield Curve as a Leading Indicator: Some Practical Issues.
With regard to the short-term rate, earlier research suggests that the three-month Treasury rate, when used in conjunction with the ten-year Treasury rate, provides a reasonable combination of accuracy and robustness in predicting U.S. recessions over long periods.
Maximum accuracy and predictive power are obtained with the secondary market three-month rate expressed on a bond-equivalent basis, rather than the constant maturity rate, which is interpolated from the daily yield curve for Treasury securities.
Spreads based on any of the rates mentioned are highly correlated with one another and may be used to predict recessions. Note, however, that the spreads may turn negative—that is, the yield curve may invert—at different points and with different frequencies.

Our preferred combination of Treasury rates proves very successful in predicting the recessions of recent decades. The monthly average spread between the ten-year constant maturity rate and the three-month secondary market rate on a bond equivalent basis has turned negative before each recession in the period from January 1968 to July 2006 (Chart1). If we convert this spread into a probability of recession twelve months ahead using the probit model described earlier (estimated with Treasury data from January 1959 to December 2005), we can match the probabilities with the recessions (Chart 2). The chart shows that the estimated probability of recession exceeded 30 percent in the case of each recession and ranged as high as 98 percent in the 1981-82 recession.
Other Spreads
The article mentions “The ten-year minus two-year spread tends to turn negative earlier and more frequently than the ten-year minus three-month spread, which is usually larger.“
That is certainly not the case today.
The 2-year yield is 1.882 whereas the 10-year yield is 2.041.
Chalk this up to QE, Fed manipulation, taper tantrums, and hedge funds front-running expected rate cut moves.
Mike “Mish” Shedlock
“The fed balance sheet” is a brilliant smoke screen.. there is no balance… its thin air
Ease that rate back down again, and let the balloon stretch out a little bit more for as long as possible.
If we are using the same measuring stick for recessions, we will never get in one because the Fed will just cut rates again and credit will get loosened. We aren’t quite at the place of pushing on a string yet. The Fed will do all it can to prevent another recession because of what it may do to the labor market. We are quickly becoming China when it comes to avoiding any pain and getting growth at any cost. We will soon enter the decade of 1/1/1. 1% growth, 1% inflation and 1% rates.
Couldnt we also say this extended “non-recession” we are in was caused a lot by the return of the credit that was destroyed/withdrawn in 2009-2010 and then replaced by 2012-etc? I had two of my unused credit cards essentially deactivated in 2009 and so thousands of dollars in credit given to me disappeared post 2008, only to be given back to me thru other cards in later years. Has all that lost credit (2008-2010) now been replaced/made available/spent and we’re back to all-time credit highs, and that is basically the reason this economic round is coming to an end?
Interest rates used to be a valuable predictor of recessions. The rates were set by an aggregation of thousands or millions of economic decisions. Now, the rates are completely distorted by central banks, mainly the FED in the US, so they have lost almost all predictive ability.
I’m sorry, but did we ever really get out of the last recession?
Comparing the current recession probability level to those leading up to recessions , the true probability of a recession is closer to 80%
Mish: “The 2-year yield is 1.882 whereas the 10-year yield is 2.041. Chalk this up to…Fed manipulation.”
Supposedly the Fed is actively engaged in “operation untwist,” selling the long end of its balance sheet and purchasing on the short end. That might explain why the 2 and 10 is not currently inverted.
It sticks out in Chart 2 that the past 6 recessions all started when the indicator was reading 40% or less. By that measure, today’s reading says recession is here.
I have also been wondering if Deutsche Bank closing its trading business and firing 18,000 people meets the criteria of a big financial firm blowing up. I suppose the next few weeks will reveal that.
Check your facts please.
“Supposedly the Fed is actively engaged in “operation untwist,” selling the long end of its balance sheet and purchasing on the short end. That might explain why the 2 and 10 is not currently inverted.”
The fed sold a whopping $5 million in 10yrs, a number so small it might have been a rounding error by a summer intern (it wasn’t, but its a tiny number).
All the other “sales” you imagined were run-offs. Bonds that matured.
Bernanke was the guy who claimed the Fed could easily normalize rates and its balance sheet. Anyone could do it, he claimed…. but he couldn’t.
Yellen also claimed there was no danger in manipulating rates, because it was easy for the giant floating heads at the Fed to reverse…. she couldn’t do it either.
The Fed has lost its power, because of Bernanke and Yellen (and a huge assist from Greenspan).
The yield curve indicator only works when bonds are market priced, not Fed priced. There hasn’t been any Treasury price discovery since Greenspan.
Well, I did preface the statement with “supposedly.” While perhaps not actively “selling,” what I read the Fed is doing, to the extent maturing securities exceed the amount it is willing to let run off, it is replacing longer term securities with shorter term securities.
It was not a highly credible source where I saw that information and I did not comb through the Fed balance sheet reports myself. Perhaps you can still refute what I said in that context?
I attempted to FIFY, but I have not had good luck with the edits after posts on this site. Here is what I should have said: “Supposedly the Fed is actively engaged in ‘operation untwist,’ replacing the long end of its balance sheet as it matures by making purchases on the short end. That might explain why the 2 and 10 is not currently inverted.”
“Chalk this up to QE”
Please don’t be a jerk and half quote me out of context.
This is what I said:
“Chalk this up to QE, Fed manipulation, taper tantrums, and hedge funds front-running expected rate cut moves.”
Yes a portion of this is QE – it lowered rates across the board and they did not return.
Trump Derangement Syndrome boomerangs back at Mish 🙂
I would argue with@2banana and try to explain run-off versus sales, but persons suffering from TDS don’t think clearly
QE ended in 2016.
Since peak-QE in January 2015, the FED has shed about $687 billion in total assets.
“Chalk this up to QE”