
Deflationary Period Over?
At Mauldin’s latest conference, Gavekal’s Louis-Vincent Gave stated “The deflationary period we’ve been in has come to an end.”
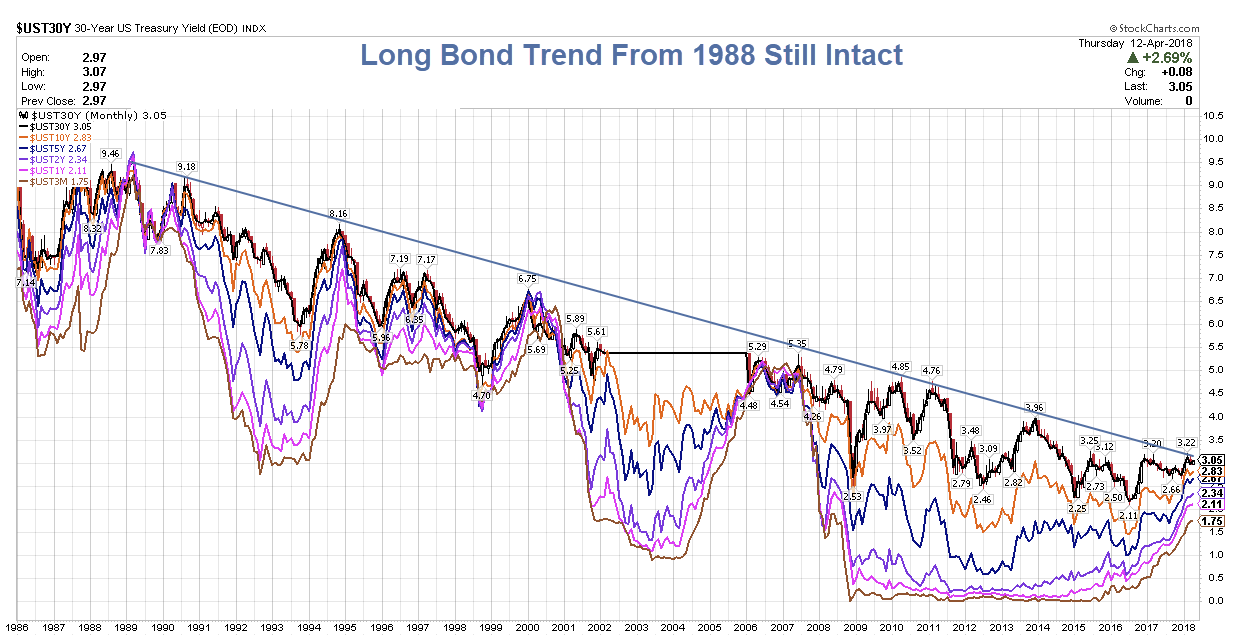
He produced this chart.

As told through the words of Steve Blumenthal … Louis-Vincent continued, “Or simply look at this (next) chart. I mean this is obviously the 30-year US Treasury bond yield, which is now, of course, broken out decisively from its downtrend, which makes sense if this deflationary environment that I’ve described is now coming to an end. And here, I just want to spend a quick second on this because I think this is very important. The markets today are giving us a very important signal.
Crayon Shortage
There appears to be a shortage of crayons.
Gave need a fatter crayon, a longer crayon, or better vision.
My chart shows the 30-year long-bond has not broken its trendline. Perhaps it will, but it hasn’t. Until it does, the alleged “signal” is as valid as the ones in 1990, 1994, 2000, and 2007.
Don’t Jump the Gun
We have not seen a secular change yet. It’s very tempting now, just as it was in 2007, to jump the gun.
Don’t do it!
Hoisington Management
Lacy Hunt at Hoisington Management is one person who has not jumped the gun.
He also presented at Mauldin’s conference.
I do not have a copy of Hunt’s presentation as it is still embargoed. But I do have a copy of the Hoisington Management Quarterly Review and Outlook for Q1 2018 (not yet posted online).
Hunt discusses the Law of diminishing returns, technology and debt. Here are a few snips:
The law of diminishing returns is already evident in all major economies as well as on a global scale. Global GDP generated per dollar of total global public and private debt dropped from 36 cents in 2007 to just 31 cents in 2017.
Diminishing returns is even more apparent in the case of China’s public and private debt, largely internally owned. In terms of each dollar of debt, China generated 61 cents of GDP growth in 2007 and only 33 cents last year. In other words, in the past ten years the efficiency of China’s debt fell 45%.
The most advanced sign of diminishing returns is in Japan, the most heavily indebted major country, where a dollar of debt in the last year produced only 22 cents of GDP growth. This economic principle applies equally to businesses.
In 1952, $3.42 of GDP was generated for every dollar of business debt, compared with only $1.39 in 2017. In the corporate sector, where capital as well as technology is most readily available, GDP generated per dollar of debt fell from $4.50 in 1952 to $2.50 in 2007 to $2.21 last year. The dismal trend in productivity confirms this conclusion.
The percent change for productivity in the last five years (2017-2012) was equal to the lowest of all five-year spans since 1952. It was also less than half the average growth over that period.
Conclusion
Important to the long-term investor is the pernicious impact of exploding debt levels. This condition will slow economic growth, and the resulting poor economic conditions will lead to lower inflation and thereby lower long-term interest rates. This suggests that high quality yields may be difficult to obtain within the next decade. In the shorter run, in accordance with Friedman’s established theory, the current monetary deceleration, or restrictive monetary policy, will bring about lower long-term interest rates.
Other Opinions
Other opinions are easy to find. For example Bloomberg reports Yield-Inversion Fear Pits JPMorgan Against Aviva Fund Manager.
Some have started to fret the bond market is portending a recession. Not James McAlevey.
The fixed-income fund manager at Aviva Investors, which oversees 243 billion euros ($301 billion) of bonds, is instead loading up on risk and yield curve-steepener trades. He expects the U.S. economy to expand — not shrink.
“The recent trade shocks aside, the U.S. economy looks like it’s on pretty firm footing,” McAlevey said in an interview.
The yield curve can’t be trusted because overzealous central bank purchases have pushed down yields and the term premium, or compensation for buying longer-dated debt, according to McAlevey. And that’s set to change as the Fed runs down its balance-sheet holdings, foreign buyers withdraw, and growth and inflation pick up.
“If the term premium goes up through time, the yield curve should start steepening,” he said. He says the gap between two- and 10-year notes, now at 48 basis points, could return to early 2017 levels of about 125 basis points.
Steepening?
I expect steepening but in the opposite sense of James McAlevey.
Steepening will occur when the Fed starts slashing rates in the next recession praying like mad to stave off debt defaults.
One Sided Boat
Seldom is opinion as certain about anything as it is today.
I discussed that idea a couple of days ago in Opinion Nearly Unanimous: Inflation Has Arrived.
One Question
I have a simple question: When is the last time such overwhelming consensus on a fundamental economic issue ever been right?
I do not rule out an inflation scare, just as we had in 2008 when crude spiked to $140.
In fact, the above Tweets and articles show it’s clear we are in the midst of such a scare right now.
When?
Yes this bond bull will end. But when?
Meanwhile I side with Lacy Hunt.
I asked him today about his average duration. He replied “a little over 20 years”.
That’s quite a conviction, and quite opposite what the consensus inflationista thinks.
The Name Is Bond
The name is Bond, Long Bond Hunt.
Mike “Mish” Shedlock
Great chart. It will be more accurate on log, instead of linear. You will get a different slope of the resistance line, which will give u more room, for the 10 Y to go higher, before a breakout. If u add CPI u will understand the Fed. They know exactly what they are doing : send most rate < CPI ==> real negative rates , gov get a discount !
No, Mr. Bond, i expect you to Die! (it’s Friday. that’s all i’ve got)
That’s an image to make anyone shudder. Are you sure Yellen doesn’t play Rosa Klebb? Seems more fitting, could totally see Janet trying to kick the average American with a poisoned switchblade shoe.
I think the primary reason taking on debt doesn’t grow GDP as much as it used to is because in the past, money was borrowed to invest in product development or production. Now most of it is for stock buybacks or covering expenses. Very little of it is put to productive use.
Aggressively – selling – as opposed to letting it expire would push uprates far more than the Fed Wants
This seems to be a debate that is akin to mental masturbation; intellectually stimulating but without practical purpose. No one knows where rates should be while various Central Banks continue to manipulate the cost of money. Until CBs stop and allow rates to seek their own, natural level, price discovery can never happen. Perhaps rates should naturally be higher? Rates may be heading higher simply because CBs are starting to ease up off the monetary pedal. Who knows? However, there are a few events that could create price pressures despite a deflationary back drop. Wars tend to be very inflationary, and trade wars also push up the cost of goods, particularly now that most consumer goods are produced in China. And of course, we are seeing massive inflation in the issuance of treasuries. While the economy is tanking, the US will still need to issue $2 trillion or so of new debt issuance each year. Only higher interest rates can guarantee that demand will be there to satisfy this massive issuance. This is the downside from years of Central Bank price manipulation.
Having money in three countries, none of which is the USA, I follow currency rates, gold and bond prices constantly. I see a lot of US-centric “charts” waning but while we don’t have a gold standard as such, I find it remarkable how accurately the currencies follow the gold price. Consequently it isn’t that the gold price is rising, it is that the US dollar is tanking. At the same time the EU is in a holding pattern while its gold price is relatively flat. The AUD follows the USD down the toilet while the UKD strengthens (sort of). The global economy depends on globally traded commodities consequently the price of something tangible like copper, gold or iron is reflected in the sentiment of the buyers using whatever currency they live by. In other words the charts are misleading until they are corrected for the state of the global commodity trade. So while gold looks like a good investment, really it’s just a hedge against the USD, for now at least. In general gold is a good hedge against inflation in a market where ROI is abysmal but its hard to believe it will ever be worth 10x its current value in every world currency. That would require the world wide synchronous evaporation of confidence in cash as a utility of trade. Given the enormous inertia from shear size of the global economy, that seems unlikely to happen quickly. Expect gold to rise, maybe double (against the global currency averages) over the next five years with or without another GFC. Use it to protect yourself against government maleficence but don’t expect it to make you rich against all global currencies any time soon.
Excellent use of ‘Bond’ Mish…