
Here are some snips from the latest Hoisington Management Quarterly Review by Lacy Hunt.
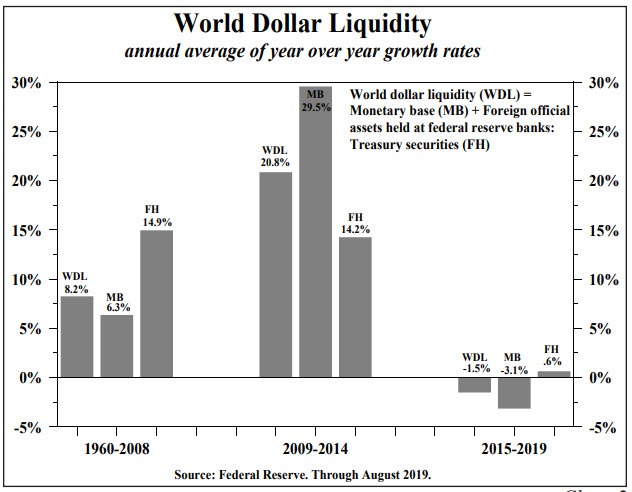
World Dollar Liquidity
The Fed’s balance sheet constriction reduced world dollar liquidity, which is defined as the monetary base plus foreign central bank holdings of U.S. Treasuries at the Federal Reserve Bank in New York. This quantity effect also served to underpin strength in the U.S. dollar, which has had the result of draining foreign central bank holdings of U.S. Treasuries impacting foreign financial markets.
World Trade Volume

The more restrictive monetary conditions spread worldwide as the velocity of money fell sharply in all their countries to levels far below the United States. Not surprisingly, global economic growth moderated in concert with U.S. economic moderation. World trade volume, which has fallen over the past year, clearly points to the universal nature of current global downturn and the result has been a disinflationary pricing of goods.
Debt Overhang
Despite the evidence that monetary policy works with long lags, the Fed appears to be waiting for a downturn in the coincident economic indicators before attempting to “get ahead” of where the market has priced interest rates. The lags between initial inversion and recession have been variable but the market is presently within the historical lagged periods. The current overrestraint of Fed policy is why 5, 10, and 20-year Treasury security yields have not set new record lows, but it is only a matter of time.
Slumping Marginal Revenue Product of Debt
For the current three-year period, using the partially available data for 2019, each dollar of global debt generated only $0.42 of GDP growth in the major economic sectors, which was down 11.1% from ten years ago. This deterioration was greater in all the major foreign economies than in the United States.
The largest percentage decrease in debt productivity, of more than 38%, was registered in China over the past ten years. The decline in the marginal revenue product of debt in Japan, the United Kingdom (U.K.) and Europe were all more than two and one-half times greater than in the United States. Over the current three-year period, the debt productivity in the U.S. was $0.40, versus $0.38, $0.36 and $0.34 in the Euro currency zone, the U.K. and China, respectively.
Outlook
The global over indebtedness has clearly restrained growth, and therefore has had a profound disinflationary impact on every major economic sector of the world. This fact, coupled with an overzealous U.S. Central Bank have created the conditions for an economic contraction in the U.S. and abroad. This has also created a worldwide decline in inflation and inflationary expectations.
A quick and dramatic shift toward greater accommodation by the Fed could begin to shift momentum from contraction toward expansion. However, policy lags are long and slow to develop, therefore despite the remarkable decline in long term yields this year, we are maintaining our long duration holdings. A shift towards shorter duration portfolios would be appropriate when the forward-looking indicators of expansion, in the U.S. and abroad, begin to appear.
Quiet Bond King
I am pleased to have Lacy Hunt as a friend. We chat frequently.
Hoisington has been at the long end of the curve, and accurately so, for long time.
Last year, Lacy informed me that Hoisington’s average duration was 20-21 years.
I asked again this morning, and got the same answer. Hoisington’s average duration is still 20-21 years.
When Lacy shifts duration dramatically lower, it will represent a major tuning point for bonds.
I expect that is still off in the distance.
Meanwhile, please recall all the accolades given to the alleged “bond king” Bill Gross.
Yet, how many incorrect bond market tops did Gross call?
The quiet bond king all along has been Lacy Hunt, seeing no notoriety or fame, but deserving both.
Mike “Mish” Shedlock
I must be against more World Dollar Liquidity since I am against more base money.
You can’t measure the effectiveness of debt in terms of how much the GDP grew vs how much debt went up. You probably could prior to about 20 years ago. But, now debt doesn’t just boost GDP, it also keeps GDP from collapsing. So, in order to determine its effect on GDP, you would have to know how much GDP would have contracted without the added debt. I suspect the change in GDP would be similar to what it used to be if taken into account.
No. Much greater than it used to be. That’s what the “policy makers” are most afraid of. That the whole castle of cards (debt obligations and stock prices that serve as collateral for more lending and rehypothecation) will collapse in one giant bonfire of deflation (repricing of credit).
Thanks sheds a great deal of light on the mismanagement of the fomc. Since 2008 it has been clown car of silly actions.
“Meanwhile, please recall all the accolades given to the alleged “bond king” Bill Gross.
Yet, how many incorrect bond market tops did Gross call?”
Not to mention the Reinhart-Rogoff magic spreadsheet, that self-corrected for errors about which “policy makers wanted to know more.”
That was a great article, btw. Steve Keen also rants about the horror that is austerity. Politicians in the EU are so hopelessly clueless, if it wasn’t so damaging to the people, it would be funny.
was on the road today – sorry for the late replies
Mish,
Any chance of a co-authored piece by you and Lacy Hunt on the future of interestrate politicies in both Europe and the US?
Thanks for asking
Lacy is pretty much his own person. But I have been on panel discussions with him. We were the only ones a few years ago who thought bond yields would drop. Not sure if he even follows Europe.
If the Chinese liquidated $41B of USA treasuries last month wouldn’t that mean they collected $41B in USD, which might be held in reserves not at Fed banks? Honestly… not exactly sure how this works.
China accumulates US dollar reserves as a function of trade surplus with the US. Sometimes they have used those reserves as a mechanism to stop capital flight.
Cheap money was just begging for a place to be wasted for years, so here we are kiddies!
The GDP-to-debt rations must be total debt outstanding; otherwise the numbers wouldn’t add up? Regardless, more debt produces less and less GDP. And to create more debt, requires lower and lower interest rates. There is some logic there, but I can’t see it.
It is not GDP-to-debt but the increase or growth of GDP compared to the increased debt (and I am assuming total debts). People often say GDP when they mean GDP growth. It’s an inaccuracy that you see more and more.
The marginal utility reduction for Chinese debt, given the numbers shown in the table, is 47% not 38%
Check the fine print in the legend below chart.
Correct, regardless of the note. If one number is suspect, so must be the other.
Yes, i’d Really prefer to see perhaps ‘a Number between 38 and 47%’ in the discussion, it reiterates that the numbers cannot be fully trusted as the data isn’t freely available and accurate. (Obviously that’s not Mish, it’s the source).
Maybe the FED needs to do more Not QE’ing.
There will be plenty more to come. This is actually MMT, thinly disguised, and it is here to stay (until final currency failure occurs).
Lacy Hunt?
I am an unabashed Groupie.
Consistently on the mark. AND backs his work with numbers. Not guesses.
Kudos
The IMF are finally waking up to the corporate $19 trillion corporate debt time bomb.
Larry Elliott is always worth following. Pro-Brexit even though he works at the Guardian.
I know plenty of equity mostly folks. Won’t touch bond market with 10′ pole. Little do most realize the corporations they own stock in are in many cases swamped with debt … and getting swampier.
Good Luck. They’ll need it come Risk Off.
If we win any harder, I’m gonna need a barf bag!
Bonds have outperformed stocks the last 1+ year and may do so for 2019 as well. The issue this time around is we face a debt supercycle the likes have which hasn’t been seen. How much debt can the system take ? Productive debt is dwindling and it takes more dollars to generate less growth. This is not productivity growth but just growth period.
Well, that is a skewed comparison. Current stockprices are insanely manipulated and do not reflect any kind of normalcy or accuracy. But your point is solid.
Agree regarding comparisons. I believe the Fed has manipulated everything to try and prevent a crisis in pensions and 401ks. Demographically that would be a disaster now versus even the late 00s here in the US. More baby boomers and older are retiring.
Kudos to Lacy Hunt and Hoisington for their masterful understanding of the global debt situation.