
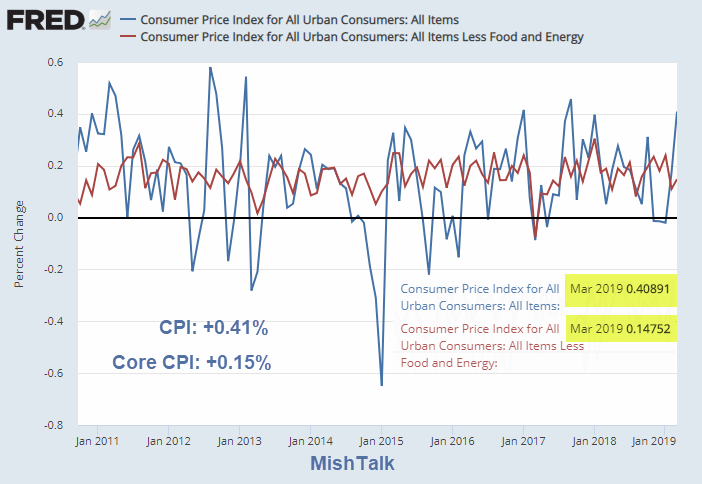
If you don’t use eat or use energy, the BLS is pleased to report the core CPI only rose 0.1%, rounded to one decimal place, 0.15% if rounded to two decimal places.
- The Consumer Price Index for All Urban Consumers (CPI-U) increased 0.4 percent in March on a seasonally adjusted basis after rising 0.2 percent in February, the U.S. Bureau of Labor Statistics reported today. Over the last 12 months, the all items index increased 1.9 percent before seasonal adjustment.
- The energy index increased 3.5 percent in March, accounting for about 60 percent of the seasonally adjusted all items monthly increase. The gasoline index increased sharply, and the electricity index also rose, although the natural gas index declined. The food index also increased in March, with the indexes for food at home and food away from home both continuing to rise.
- The index for all items less food and energy increased 0.1 percent in March, the same increase as in February. The indexes for shelter, medical care, new vehicles, recreation, education, and tobacco were among those that increased in March, while the indexes for apparel, used cars and trucks, and airline fares all declined.
- The all items index increased 1.9 percent for the 12 months ending March, a larger increase than the 1.5-percent rise for the period ending February. The index for all items less food and energy rose 2.0 percent over the last 12 months. The food index rose 2.1 percent over the past year, its largest 12-month increase since the period ending March 2015, while the energy index declined 0.4 percent over the past year.
Food
- The food index rose 0.3 percent in March following a 0.4-percent increase in February. The index for food at home rose 0.4 percent in March, the same increase as the prior month. The index for fruits and vegetables rose 1.6 percent, with the index for fresh vegetables increasing 2.0 percent and the index for fresh fruits rising 1.2 percent. The dairy and related products index increased 0.6 percent, and the cereals and bakery products index rose 0.3 percent. The index for other food at home also increased in March, rising 0.1 percent.
- The index for meats, poultry, fish, and eggs was the only major grocery store food group index to decline in March, falling 0.2 percent after rising 0.2 percent in February. The index for nonalcoholic beverages was unchanged in March after increasing in each of the prior 3 months.
Energy
The energy index rose 3.5 percent in March. The gasoline index rose 6.5 percent in March after increasing 1.5 percent in February. (Before seasonal adjustment, gasoline prices rose 9.0 percent in March.) The electricity index also increased in March, rising 0.4 percent after falling in January and February. The index for natural gas declined for the third month in a row, falling 0.1 percent in March.
Despite the increase in March, the energy index fell slightly over the last 12 months, declining 0.4 percent. The index for gasoline fell 0.7 percent, while the index for natural gas declined 1.4 percent. The electricity index, in contrast, increased 0.3 percent over the last 12 months.
All items less food and energy
The index for all items less food and energy increased 0.1 percent in March, the same monthly increase as in February. The shelter index continued to rise, increasing 0.4 percent. The index for rent rose 0.4 percent, while the index for owners’ equivalent rent increased 0.3 percent.
The medical care index, which declined in February, rose 0.3 percent in March. The index for prescription drugs increased 0.6 percent in March following a 1.0-percent decline in February. The index for hospital services also increased in March, rising 0.3 percent, but the index for physicians’ services declined, falling 0.4 percent.
The index for new vehicles increased 0.4 percent in March after declining in February. The recreation index rose 0.3 percent, and the education index advanced 0.5 percent. The index for tobacco increased 1.6 percent, its largest increase since April 2017.
In contrast, the index for apparel declined 1.9 percent in March after rising in February. The index for used cars and trucks fell for the second month in a row in March, declining 0.4 percent. The index for airline fares fell in March, decreasing 0.6 percent after rising in February. Also declining in March were the indexes for communication and for motor vehicle insurance.
Year-Over-Year

The index for all items less food and energy rose 2.0 percent over the past 12 months, a slightly smaller increase than the 2.1-percent rise for the period ending February. The shelter index rose 3.4 percent over the span, and the medical care index increased 1.7 percent. The indexes for apparel, airline fares, and communication all declined for the 12 months ending March.
The green line above id the Producer Price Index (PPI). The BLS reports those numbers tomorrow.
Bond Market Reaction

Bond yields fell on the report, presumably because the core CPI under-performed as if people don’t eat or use energy.
Mike “Mish” Shedlock


Medical care accounts for 6.9% of CPI *yet* healthcare spending is 18% of GDP. This makes zero sense at all.
Basically the Fed changes methodology to fit their argument. Using the original method for inflation, we are running at about 7%.
The original CPI dramatically overstated inflation. That was one of the first things they taught us in business school. We were told to never, ever even consider agreeing to any payment that was indexed to CPI as it would consistently go up 3-4% faster that actual inflation. The overstated CPI led to a doubling of the living standard of the elderly in the 20 years between 1970 and 1990, and was one of the reasons social security was bankrupt. Had the CPI not been fixed, it would be out of money already.
The GNP Deflator has long been a better measure, and it has needed no adjustment. After adjustment, the CPI is now very close to the GDP deflator, but it’s a lot harder to compute, so I don’t know why they even bother.
But they also replaced human food with equivalents like cat food. This was done across all products. Let’s face it. The inflation numbers are controlled in order to set the policy they want. The numbers dont actually drive it.
A key measure of U.S. inflation rose less than forecast in March on a drop in apparel prices following a methodology change for data collection, offering some reinforcement for the Federal Reserve’s message of patience on interest rates.
A better name for it would be the “stablized inflation” number. It excludes the most volatile items, since food and energy tend to go up or down quickly. Yet, a quick look at the graph posted above makes it obvious that the two are equal over a longer term. There are periods of up to 1-2 years where one number is higher than the other number, but it is always offset by another period where the situation reverses.
From 2012-17, the “core items” inflation was mostly been higher than the “all-items” inflation, since energy prices have been falling. More recently energy prices have been rising, however, so from 2017-19, the “core items” have been slightly lower than “all-items”.
Over the long term, the two numbers are essentially the same. If you look at a 5-10 year time period, or longer, there isn’t going to be any significant difference.
“Core CPI is a strange term for a CPI that excludes the core items. Peripheral CPI would be more accurate.”
Interesting comment Jan
I would call core CPI: Food, Energy, Shelter – Those are things everyone buys constantly.
Ex-volatile CPI.
Core CPI is a strange term for a CPI that excludes the core items. Peripheral CPI would be more accurate.