
Today the Census Department released the New Residential Construction Report for May 2023.
The report contains more enormous revisions.
Last month I stated “History suggests the April rise will be revised away in May.”
Sure enough. The Commerce Department revised housing starts in April from 1,401,000 to 1,340,000. That’s a negative revision of 4.4 percent. The big jump in April is now a reported decline. So take the huge jump this month with with a heavy dose of skepticism.
April Revision Notice
With this release, unadjusted estimates of housing units authorized by building permits for January through December 2022 have been revised. Also, seasonally adjusted estimates of housing units authorized by building permits have been revised back to January 2017, and seasonally adjusted estimates of housing units authorized but not started, started, under construction, and completed have been revised back to January 2018. All revised estimates are available on our website.
Building Permits
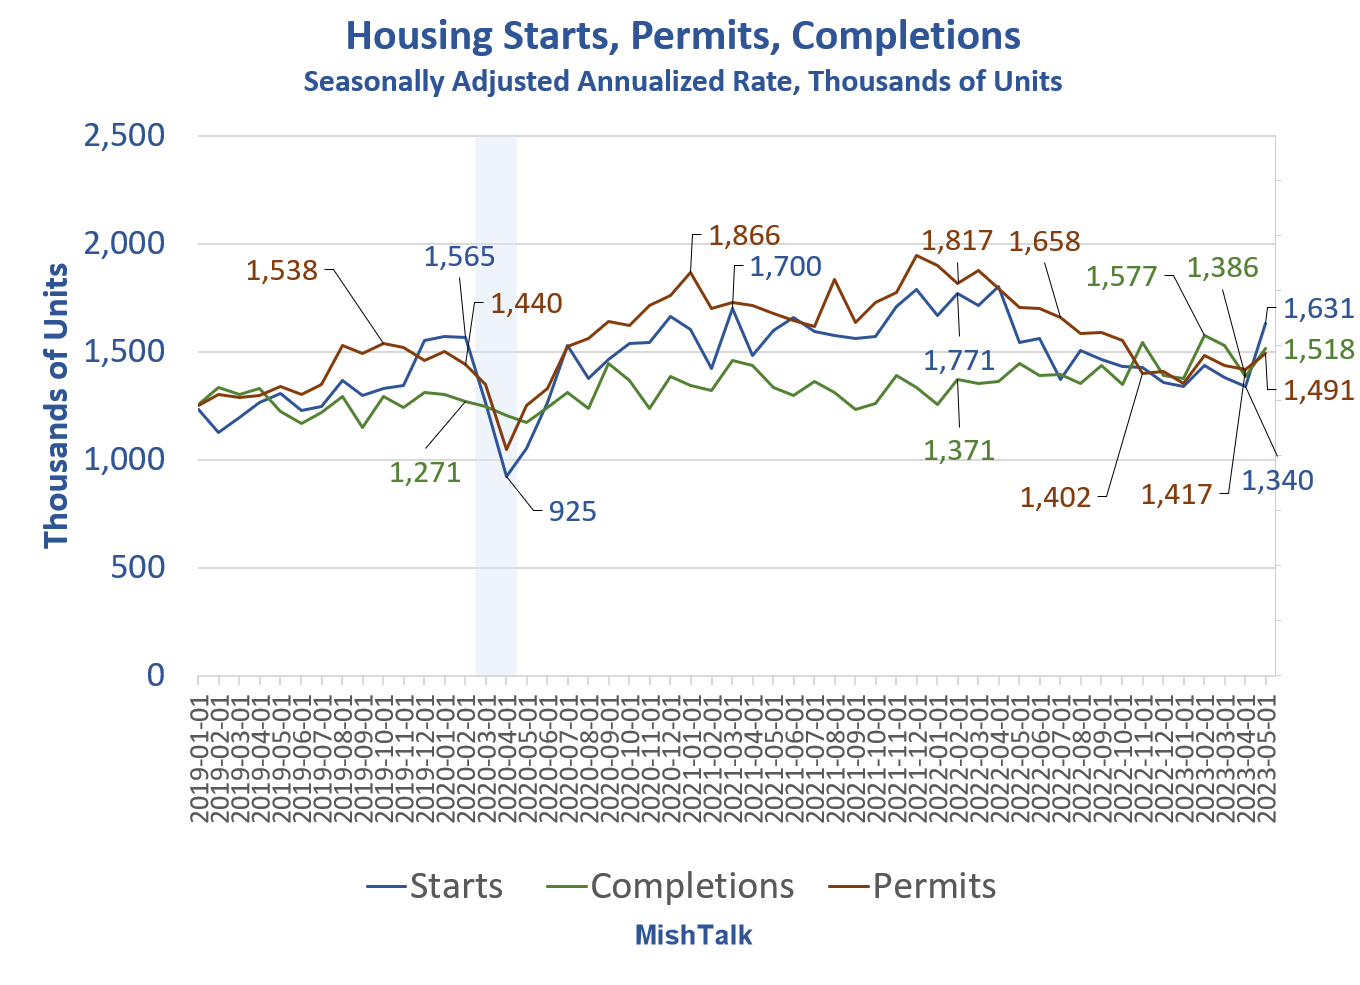
- Privately‐owned housing units authorized by building permits in May were at a seasonally adjusted annual rate of 1,491,000. This is 5.2 percent above the revised April rate of 1,417,000, but is 12.7 percent below the May 2022 rate of 1,708,000.
- Single‐family authorizations in May were at a rate of 897,000; this is 4.8 percent above the revised April figure of 856,000.
- Authorizations of units in buildings with five units or more were at a rate of 542,000 in May
Housing Starts
- Privately‐owned housing starts in May were at a seasonally adjusted annual rate of 1,631,000. This is 21.7 percent (±14.8 percent) above the revised April estimate of 1,340,000 and is 5.7 percent (±10.8 percent) above the May 2022 rate of 1,543,000.
- Single‐family housing starts in May were at a rate of 997,000; this is 18.5 percent (±14.1percent) above the revised April figure of 841,000.
- The May rate for units in buildings with five units or more was 624,000.
Housing Completions
- Privately‐owned housing completions in May were at a seasonally adjusted annual rate of 1,518,000. This is 9.5 percent (±12.3 percent) above the revised April estimate of 1,386,000 and is 5.0 percent (±13.0 percent) above the May 2022 rate of 1,446,000.
- Single‐family housing completions in May were at a rate of 1,009,000; this is 3.9 percent (±13.9 percent) above the revised April rate of 971,000.
- The May rate for units in buildings with five units or more was 493,000.
Note the margins of error in these stats. And they are needed.
History suggests the May rise will be revised away in June just as the big jump in April was revised away in May. I did not take a dive into the published revisions all the way back to 2017.
Housing Starts Single Family vs Multi-Family

Of the alleged 1.631 million seasonally-adjusted, annualized starts, 997,000 were single-family and 634,000 multi-family.
The actual number of starts in May was 151,000 not 1.631 million.
Unadjusted Numbers

Easy Comparisons Looking Ahead
Housing starts are 12.7 percent below the level of a year ago. Looking ahead, year-over-year comparisons will be much easier.
This post originated at MishTalk.Com
Mish
Great report!
Mish great report and update on this number. Again people are looking at this making awful judgements.
[…] For discussion, please see Another Heavily Revised Housing Starts Joke of a Report for May 2023 […]
Love your work. Always fact based.
What a shock. Historical data back to 1800 puts the average correction timeframe at 4 years 6 months. Viewing the past 3 corrections (1979-1983, 1989-1996, 2006-2012) at 4, 7, and 3 years respectively (and adding in a very brief 6 month downturn in 2001-2002), do the math and what do you get. 4 years and 6 months. It’s never different.
In addition, again looking at actual data, the vast majority of corrections featured an initial downturn, followed by a brief pause/upturn, and then an accelerated correction. It’s never different.
So far, this correction is playing out just like most of them have. Those who say “it’s different this time” are more than likely to be proven wrong. The reality is, it’s never different.
Lastly, all the housing bulls want to ignore the 3 year foreclosure moratorium. With a 100 year average of a 1.5% rate of foreclosure that was effectively zero for 3 years, it’s laughable when they point to the low foreclosure rate as their evidence of a bull case.
Of course, I could be wrong. But since it’s never been different over 230 years, I’ll go with history.
Oh, and one final point. In the past 13 recessions, beginning in 1960, 9 of them featured mean reverting corrections in housing…and the real damage did not occur until after the FED started to cut rates. And we are a long long way from that. This correction will take years to play out. Bottom in 2026 maybe. 2027 more likely. 2028 not out of bounds.
Wrong it looks like housing is in another boom cycle. The millennials + Gen z ( effectively the same generation) is larger in number than the boomers. 7% mortgage with 10% down still less than rent on an average 500,000 -750,000 home
Yet they are living or moving back into their parents/grandparents homes!!!
i concur. the amount of printing during plague made r/e go up the most nationwide in short time frame. the down trend will be years, and years. really slow so far, but trending down in price.
First, I like the new format. I don’t see reduced housing starts as a bad thing. Housing is down a bit and it would be better to see a soft landing than have a glut come to market and crash the prices. Hot markets (like mine in central NC) are still building like crazy.
Haha You would think the gov would want to have accurate data to make decisions. Might as well be guessing.
Mish ive been pondering Is there an actual housing shortage? Or is it just houses are tied up with other uses or not located in areas where people are moving.
A big population bubble is passing on. Leaving more houses per population.
A large number of houses that got tied up in corporation rentals during the housing crises.
People are air b@b ing their second and inherited homes.
Im sure im missing some other factors.
Do you have any thoughts?
The Atlanta Fed GDPnow raised their estimate for 2nd residential investment from -2.1% to +2.2%. If it wasn’t clear already residential investment will no longer be a drag on GDP like it was last year.