
CDC Stats US 2019-2020 Influenza Season
Data Sources
- Influenza data from the CDC.
- Covid data from Our World in Data.
- Fatality rate from Johns Hopkins.
Trump Flashback March 9
Trump Flashback March 13
All Red Tape has Been Cut!
Think About This
- March 9 Trump: “At this moment there are 546 confirmed cases of CoronaVirus, with 22 deaths. Think about that!“
- March 13 Trump: “Testing will soon happen on a very large scale basis. All Red Tape has been cut, ready to go!“
- November 19 Johns Hopkins: 257,329 deaths and counting
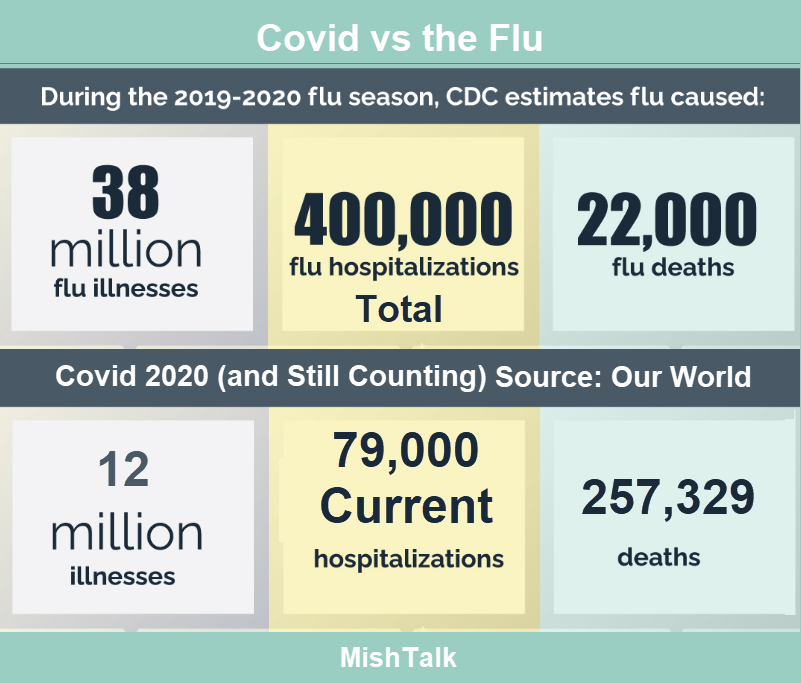
- CDC 2019-2020 Influenza Season Deaths: 21,909
- CDC 2019-2020 Influenza Season Cases: 38,194,505
Observed Covid Fatality Rate Johns Hopkins

Fatality Rate Flu vs Covid – My Calculations
- Flu: 22,000 / 38,000,000 * 100 = 0.058%
- Covid: 257,329 / 12,000,000 * 100 = 2.144%
The death rate from Covid is 37 times greater than the flu.
Think about that while making the claim “Covid is no worse than the flu.”
Challenge on CFR vs IFR

See Estimating Mortality From COVID-19 for discussion.
There are two measures used to assess the proportion of infected individuals with fatal outcomes. The first is infection fatality ratio (IFR), which estimates this proportion of deaths among all infected individuals. The second is case fatality ratio (CFR), which estimates this proportion of deaths among identified confirmed cases.
To measure IFR accurately, a complete picture of the number of infections of, and deaths caused by, the disease must be known. Consequently, at this early stage of the pandemic, most estimates of fatality ratios have been based on cases detected through surveillance and calculated using crude methods, giving rise to widely variable estimates of CFR by country – from less than 0.1% to over 25%.
Countries have varying approaches to COVID-19 case definitions. Consequently, the numerator and the denominator of any formula used to calculate fatality rate will vary according to how they are defined.
OK, the bottom line is still 22,000 dead vs 257,329.
Here is a proposed factor to consider.
Mish


Welcome to https://teluguloop.com/telugu-wishes/ Anyways great post!
You seem unaware that the flu kills between 50,000-100,000 people a year in the US
You seem unaware that they actually are only able to count 5-8,000 identifiable flu deaths in most years. At the end of the season, they use the “excess deaths” metric to adjust that upwards with a multiplier of 4 to 6 depending on the year, to obtain the “official” death count, which actually runs about 34-43,000 in most years, occasionally running as high as 61,000. At the end of Covid season, the CDC will do the same thing. They will determine an appropriate multiplier based on excess deaths, and adjust Covid deaths up. Based on the data so far, it appears that the multiplier will be about 1.2.
My guess is that by the end of March they will count 450-600,000 Covid deaths, which will be adjusted to 500-800,000. That will compare to the 37,000 average flu deaths.
Your facts are wrong, There are typically 50,000-100,000 flu deaths per year in the US;https://www.cdc.gov/flu/about/burden/past-seasons.html. The number of people who have had Covid is 8 times higher than people who have been officially diagnosed with it https://www.usatoday.com/story/news/health/2020/11/26/covid-news-cdc-joe-biden-los-angeles-coronavirus/6427266002/ Therefore the actual mortality for the flu is double your number and for Covid19 the rate is 8 times less than your number. Covid19 mortality is less than double Using the last complete numbers from CDC in 2017 the numbers for the Fku compared to Covid19 are
https://www.cdc.gov/flu/about/burden/past-seasons.html.
DEATHS INFECTED MORTALITY
FLU 95000 58000000 0.16%
COVID19 257329 x 8= 96000000 0.27%
As hospitals learn more about treating Covid19, the numbers have been dropping and eventually will end up being close to the Flu. Fearmongering and ignorance does not help anyone except politicians.
In the documents that I have seen from the CDC, they combine people who had the flu and died from flu acquired pneumonia with people who died from pneumonia as the ONLY infection. So the yearly flu deaths are greatly inflated. Why to they inflate the flu deaths?
I’m glad you asked that question! The CDC works with Big Pharma to scare the public into getting the flu shots. The actual deaths from the flu each year has usually ranged from 350 to 14,000. If you go to to the CDC web site you can see the number of flu deaths and the number of pneumonia deaths and they draw lines to the right of the page and combine the lines and the combined figure is listed as flu deaths. This makes the COVID-19 mortality rate even greater in comparison with the true flu death rate.
Not just COVID: Nursing home neglect deaths surge in shadows
By MATT SEDENSKY and BERNARD CONDON
18 Nov 2020
When COVID-19 tore through Donald Wallace’s nursing home, he was one of the lucky few to avoid infection.
He died a horrible death anyway.
Hale and happy before the pandemic, the 75-year-old retired Alabama truck driver became so malnourished and dehydrated that he dropped to 98 pounds and looked to his son like he’d been in a concentration camp. Septic shock suggested an untreated urinary infection, E. coli in his body from his own feces hinted at poor hygiene, and aspiration pneumonia indicated Wallace, who needed help with meals, had likely choked on his food.
“He couldn’t even hold his head up straight because he had gotten so weak,” said his son, Kevin Amerson. “They stopped taking care of him. They abandoned him.”
As more than 90,000 of the nation’s long-term care residents have died in a pandemic that has pushed staffs to the limit, advocates for the elderly say a tandem wave of death separate from the virus has quietly claimed tens of thousands more, often because overburdened workers haven’t been able to give them the care they need.
….
Mike, you obviously don’t know what you’re talking about. First as to the supposed covid-19 deaths, from the cdc’s own data that you can find here https://www.cdc.gov/nchs/nvss/vsrr/covid_weekly/index.htm
the number of people who have actually died from covid-19 is closer to around 10k. What you fail to understand is that up until the “covid-19”, the way deaths were recorded was the underlying condition (i.e. the initial condition that caused your decline in health) is recorded on the first page of the death certificate as the main cause of death. The illness that you had the pushed you over the edge after the decline in your health was called your immediate cause of death and is recorded on the second page. It is because of this system that we can know who died of heart disease, cancer, etc. Now, there was a directive from the CDC that allowed for the recording the immediate cause of death as the underlying cause of death but even worse, a medical professional was allowed to record the illness as being covid-19 without even the requirement of any valid test! Finally, the cherry on top is hospitals and medical centres were given $15k for every covid-19 case they treated!!! So obviously someone at the CDC found the numbers so egregious that they went back, worked with the hospitals and medical centres and corrected the numbers.
Second, you might say that the PCR testing proves that they died of covid-19! And there you would be wrong. The test has no scientific validity. If you want to read about it, here is an article that goes into depth. https://off-guardian.org/2020/06/27/covid19-pcr-tests-are-scientifically-meaningless/
The reason why is first, the sample taken from the patient is not filtered of contaminants including dead viruses. Note that your human virome contains an estimated 380 trillion viruses. Second, no lab around the world has ever isolated a SARS-COV2 virus and proven that it causes covid-19. If you want to know more, read the above cited article on pcr tests. So with no golden copy of the virus, what are they comparing against? It turns out that what they did was to splice together 150-200 base pairs from RNA slices into what they think is the virus!?! It only exists on a computer!!! You can read what Dr. Andrew Kaufman says about it here.
The final part is the amplification cycles. So this is used to increase the quantity of what is in the sample. As I mentioned previously the sample is contaminated with everything that exist in your virome, lungs, etc. Even the creater of PCR Kary Mullis said that if you amplify any sample enough that you will find anything that you want there. That is why he said that it should not be used for diagnostic purposes. See Kary Mullis speak about it here. https://off-guardian.org/2020/10/05/pcr-inventor-it-doesnt-tell-you-that-you-are-sick/
So where are we now. We have the following:
Well, let’s look at total deaths in the US this year up until now:
2015: 2,712,630
2016: 2,744,248
2017: 2,813,503
2018: 2,839,205
2019: 2900,689
2020 (up until November 16th): 2,487,350
So we are presently running at a lower death rate than in previous years. Even with all the sheninagans and the massaging of covid-19 numbers it is clear that this year is nothing special. I will leave you with one other fact that comes from the centre of evidence based medicine. It compares swine flu to covid-19. The CDC estimated that 150, 000 to 575,000 people died from (H1N1) pandemic virus infection in the first year of the outbreak. Here is the key thing to note about the difference between a real pandemic and seasonal influenza:
Even if we assume that all of the deaths that you cited were covid-19, if you look at the profile, it meets that of seasonal influenza not a real pandemic. So your arguments don’t hold water.
Interesting debate, up here in Canada, the issue of the sick and elderly was quickly resolved as the initial deaths were primarily in old age residences where, by their nature, the elderly already have severe underlying conditions.
I think that the death rate is an interesting statistic, but again watching the numbers will impact those numbers. Road accidents are way down as are murders as more people stay indoors and bars/restaurants are closed.
What we are seeing up here is a push to close schools in January (again) but not to shut down the economy — the economy cannot suffer a second shut down without seriously affecting the country’s economy (which is made of people).
Yes interesting information. When we had the first lock down (bars closed) murders with guns were virtually nonexistent in our area (Central Florida). There were still the same amount of guns in the world only difference is the bars were closed. Therefore its not really the guns killing people it was the bars! Hmmmmm who would have thunkit.
Between less travel and closures of bars we may make up the difference in deaths and make COVID less than a flu…. Plus we got all this free money and we got a new President…. well almost soon I think. If it wasn’t for COVID Trump might have just eeked out another one.
I guess we have to take our medicine one way or another.
I would agree that computing different CFRs for different age groups would be far more useful.
I side with Ron Paul’s assessment.
Besides that, he still defends Libertarian values.
Looks like my post was pulled… for pointing out that Flu only was 22K and COVID only was 105K deaths.
But, if you look at the CDC co-morbidities there are 99K FLU+COVID deaths. So, the flu did not go away, it’s deadly when combine with COVID – something everyone ignores.
And I think everyone should read the 2019 WHO pandemic plan it’s 91 pages of NPI responses that we chose to ignore and went with unproven lockdowns, school closures and masks – which is NOT recommended by the WHO for any mid to mild pandemic.
hi Mish, WHO said the fatality rate is about 0.14% from Covid about a month ago:
Now do deaths “with” C19 and “of” C19
If you’re in hospice or an LTC, dying of old-age & cancer, but get C19, you’re counted as a C19 death. Then, do a death certificate search and separate “primary” versus “secondary” cause of death. Is C19 bad? Of course, but thankfully unlike the flu, it’s not killing our kids the same way.
Policy is being made with a sledgehammer when a scalpel should have been used. The cost of which we won’t truly know for some time (uneducated children, businesses destroyed, suicides, OD’s, etc).
The whole “with Covid” versus “of Covid” is a joke, and if you think about it, you will realize why. If you get Covid, you don’t fall over and die. Covid causes major systems in the body do stop working, and leads to kidney failure, ARDS, strokes, and heart problems. Those, in turn, are the actual, proximate cause of death. A death certificate would have to be filled out incorrectly to list Covid as the “primary” cause of death. The “primary” cause would be the kidney, heart, lung, or whatever is the immediate cause, while the underlying reason, covid, would be listed on the death certificate as well. Yet, without Covid, those other problems would not have occurred, and the person would remain alive.
Now consider all the people dying at home, who never get tested for Covid. Unless there is an autopsy, they will not be counted as a Covid death, and there will not be an autopsy. Next consider a person dying in a long term care facility, where they owner has a vested interest for it not to be known that Covid was present in the facility. Then consider a person driving down the road, who has a sudden stroke caused by Covid, and whose death is recorded as an auto fatality.
There are far more ways to undercount than there are to overcount, which is why efforts to specifically count deaths from one particular cause are always going to be low. The CDC, once this is over, will estimate the real deaths deaths the same way they do every year for the flu. In a normal year, they find 6-10,000 deaths recorded as caused by the flu, but then estimate that due to undercounting, the real number was probably 24-50,000.
For Covid they will do the same thing. They will look at excess deaths, and increase the final number for Covid deaths. Because the deaths are being tracked fairly well, the adjustment will be smaller than it is for the flu. I’m guessing that they will increase the count about 20-30%, rather than the 400-600% increase they give to flu deaths.
Well said, better than I could have
Good Stuff Mish Thanks for bringing some numbers into the discussion. Still a little early but we should be able to start to get a better understanding. There is no doubt COVID is worse than the flu.
22,000 deaths seems a bit low in 2017 there were 55k from Influenza and pneumonia maybe a light season or could some of those deaths trickled into COVID?
Where did the 38 million come from? actual tests or an estimate. And to think this was with vaccines yikes! Looks like the 38 million is an estimate? Is it our estimate that only 12 million have had the Corna Virus? Seems low. Do we have any “scientists or doctors” estimating the actual number of cases we have had? A quick google https://www.statnews.com/2020/07/21/cdc-study-actual-covid-19-cases/ has a 6 to 24 times more cases. If you use an estimate say 15 that would give you 257,329/180,000,000 (12mill x15) = 0.14% or 2.4 times worse than flu. the range would give 6.2 – 1.6 times worse than flu. If 24 times is anywhere close then if the “herd theory” has any merit would be be getting pretty close to start taking effect soon. And we are certainly not seeing that at least not right now I don’t think.
Keep the numbers flowing. It’s great to see many posts and only a couple about the elections maybe we are returning to some more important matters!
Be cautious about those 6 to 24 numbers. Note that North Dakota has now reached 9% in actual positive tests. Multiply that by 6 to 24 and that means 54% to 216% of their population has been infected. Also, look at some smaller samples, such as Clay County, Nebraska, where 49% of the population has tested positive, and where 6 to 24 would mean that each person in the county has now had Covid between 3 and 12 times.
😉
Agree good point. 24 seems a bit of hyperbole..but I have no clue relying on the experts!
That 6 to 24 number came from very early in the pandemic. The article was printed in July, meaning that the data was most likely from April-May. Testing was very limited at that time, so undertesting was common. These days it is much easier to get a test, so there are probably less cases going undetected.
The truth is that there is probably no magic number, and the percentage of cases that go undetected probably varies widely from city to city and state to state. In the end the one thing we really know is that “herd immunity”, if it exists at all, will not occur until about 80% of the people have immunity, whether acquired by vaccine or by infection. We can also guess that there is a significant number of cases that go undetected. Therefore, we can guess that cases will start going down in some areas at numbers significantly lower than 80%.
At what point will we begin to see evidence of herd immunity, and what will it look like? The second question is the easier one to answer. Cases will start falling, about as fast as they went up, and they will stay down, at least until immunity starts to wear off. To be honest, I was hoping for 9-10x as many undetected cases (or people with immunity shared with covid cold viruses), in which case, once a state reached about 8-9% positive tests, cases would slow and vanish. Sadly, we haven’t seen that, at least not yet. Will it happen at 12%? 15%? 25%? 70%? We won’t know until it happens.
The comparison between the flu and Covid is imperfect, and always will be:
Some of these make Covid look worse, some make it look better. In the end it comes down to total fatalities. In an average year, each active flu variant kills about 7,000 people. It would appear that when Covid has run its course, it will have killed somewhere between 400,000 and 800,000 people. That’s the comparison I use.
CDC estimate on IFR is 0.25% (that’s a couple months old, not sure if it’s changed significantly very recently).
Not sure if they’re right, but they still estimate that we’re missing counts for 90% of the infections.
First, the flu numbers above are computed using estimates for “Symptomatic patients”. There are many people that have the flu, but no symptoms. Should they be included as well? If you are going to include asymptomatic Covid patients, you should include asymptomatic flu patients as well, if you want the numbers to be comparable.
Second, we now have enough data now to know that we are not missing 90% of the infections. If we are missing 90% of the infections, that means that in North Dakota, where 9% of the people have tested positive, 99% of the people have already been infected. If true, they would have already have reached herd immunity days ago, but clearly they have not. Yesterday alone, 0.181% of their population tested positive, which was the highest of any state in the country yesterday. [Note that this does not mean we aren’t missing 50% of the cases, or some other number. It just means that 90% is definitely not the correct number.]
Even more striking are small samples, like Clay County, Nebraska, where a population of 654 people. Two weeks ago they had 34% of people who had tested positive. If we are missing 2/3 of the cases (as opposed to 90%), that would mean that 100% of their population had had Covid, and they would have total herd immunity. Unfortunately, rather than seeing cases peter out on their own, another 15% tested positive in the following 2 weeks. So, now 49% of the people have tested positive. Will that be enough for herd immunity, and will cases finally stop appearing in that small county? Only time will tell, but it does not appear to be slowing yet.
So, yes, some cases are definitely missed. Other people may have immunity to begin with. But, we do know from what we are seeing in a full state like North Dakota, that we are not missing 90% of the cases, and smaller samples like Clay County do not give reason for optimism that we are close to the end of the pandemic yet.
And there is a good probability one can get a mild case again beyond 6 months out from first case, mebbe be asymptomatic to mild but still contagious!
Is there more data that now says that a follow-on case is now milder? I know the initial data said that there was evidence in both directions – cases that were milder and cases that were worse. Just wondering if more data had narrowed that down more…
Pandemic Vs Endemic!
Mish thats 250000 with mask/6 ft and economy shut down. Numbers would be higher.
Like i said before. I ve had it i suggest you try to avoid it. It may not kill you but it may also leave you with longterm issues.
Or it may not. I suggest people try to avoid getting hit by meteors also. They MAY get injured.
These numbers are low for Covid especially since we are gonna average quite a few deaths over 2k per day thru the end of the year. Plus this does not include excess deaths. As far as the normal flu deaths they are not counted directly but interpolated from excess deaths. The other huge issue is a lot of folks have far more lasting damage from Covid than the flu.
From
In NYC they estimate 1.4% IFR , with 4.5% of that being healthy under 65, which is 0.063 % IFR for that group if I calculated correctly, or one fatality in slightly less than 2000 infections for that age group.
After that it is maybe a matter of own perspective, and whatever other incidence (for example sequela or economic cost) are chosen to be included. Being forcefully locked up at home is questionable though.
Grosso Modo.
In other words if everyone under 65 caught the virus in the US there would be 150 000 fatalities.
In the US there are near 3 mn fatalities a year, for perspective.
The cost in lives of lockdowns, vaccinations etc. is/would be … ?
The link points to a study that is dated May 14, 2020.
If you’re over 40, better to get the flu. If under 10, better to get COVID. Fight me.
Do you know what happens to a person whose immune system is never challenged and never develops?
The Boomers were in their teens and 20s in 1958 and 1968, a much younger bulge of population range then.
The country was not a majority obese/morbidly obese in those years.
The country was not full of diabetes cases in those years.
The country did not have the Healthcare/Pharma/Health Insurance industrial complex n those years.
100,000 in U.S. and 1,000,000 worldwide died in the 1968 Pandemic (H3N2 virus). World population then was 3,400,000,000, less than half of present.
116,000 in U.S. and 1,100,000 worldwide died in 1957-1958 Pandemic (H2N2 virus) World population then was 3,000,000,000.
Time for Mish to lead a lynch mob to yank down the statues of LBJ and Ike.
Number of supposed Covid-19 dead in the USA is ~260k now. Which is only 0.0764% of our current 340,000,000 population. That’s almost a rounding error against the population size.
Waiting for the Social Security actuary to yell Halleluiah: “Not only did everyone die on time, 1,000 per day extra died. I will have to rerun the numbers to compute when the Fund runs out of US Treasuries.”
Pathetic comp Mish.
0.014% – that’s the true number.
Here’s the healthy, control data set, US active duty military. 69,390 confirmed cases with 793 hospitalizations and … 10 deaths. That’s right, 10. Or a 0.014% death rate – for CONFIRMED cases.
It’s amazing how deaf, dumb, and blind some people are.
Um….I went back to the reply to the previous article I posted with the link to the view of Dr. Roger Hodkinson, and saw there were 14 replies to it. I didn’t read them yet because it’s late and probably some argument etc. 😐
He draws a clear distinction between those vulnerable and those not. I think we can all agree on this at least. After that there are a lot of questions, a lot of uncertainty, as pertains to the rest of the population , as pertains to testing efficacy and statistics, as pertains to sequela and strain. That is not even including arguments over how effective various measures are or might be.
It does need arguing, we deserve clearer answers and clear accountability and explanation for the methods and policies that are being enacted by various governments.
Just to repeat that I really don’t have a set answer one way or the other. There won’t be a single answer either, but I think we should expect any given to remain within a broader level of reasoning, and unfortunately I am not finding this from mainstream presentation, which seems to have turned into an extreme, met by an equally adamant counter-reaction. That the middle ground is not discussed I find disturbing, and suspicious – it is the “duty” of media and of government to validate their relative approaches.
Drama, real world drama, is not automatic validation of the way it is presented, or to whatever measures are chosen as reply.
250,000 Americans have died from Covid19. Doesn’t sound like the flu
Oh please. 0.014% – that’s the true number.
The healthy, control data set is the US active duty military.
69,390 confirmed cases with 793 hospitalizations and … 10 deaths.
That’s right, 10.
Or a 0.014% death rate – for CONFIRMED cases.
Stop believing the lies about what is really going on.
Number is closer to 260k now. Which is only 0.0764% of our current 340,000,000 population. That’s less than 1/10 of 1% if decimals don’t work for you.
Thank you for this analysis.
Interesting how the Trump zombies are all too happy to throw the old codgers overboard in their desire to pump up the stock market. It tells you a lot about what they consider important in life.
EXCESS Deaths is what we should be talking about – and no one is.
When the year is over, we will know how many EXCESS deaths there were, and not just those of the very elderly that were pulled forward by a month or two.
Actually it’s well tracked, as of late. The CDC has a ton of information on it now.
So far this year there are more than 300K excess deaths……which you math fans might recognize as being MORE than the total number of reported COVID deaths,
The most likely explanation is that the reported count of COVID mortality is LOW….not high.
Not nescessarily, in UK they reported a 25 000 mortality due to measures used to combat the virus. Sorry no link but it was up somewhere or other.
Excess deaths is a statistical anomaly, and the numbers tend to be quite noisy, so you cannot base any strong claims on them.
I recently saw an article blaming 100,000 extra deaths in the USA on non-Covid causes, mainly attributed to heart disease, cancer, and Alzheimer. The latter is not just speculation about statistical anomalies, because the cause of death is noted and tallied year over year, and these were all non-Covid related.
“Excess deaths is a statistical anomaly, and the numbers tend to be quite noisy.”
Not THAT damn noisy. I think it’s generally agreed it’s about the best we tool we have to estimate COVID mortality.
The fact that excess deaths so far this year are a full 20% higher than the reported COVID mortality numbers is strongly suggestive that we’e undercounting COVID deaths….period. Feel free to post a link to your evidence to the contrary.
You can make better arguments that CASES might be overcounted…..for various reasons, all involving money…but I think that’s probably wrong too, and in time we’ll see it.
Excess deaths is a malleable metric.
0.014% – that’s the true number.
The healthy, control data set is the US active duty military.
69,390 confirmed cases with 793 hospitalizations and … 10 deaths.
That’s right, 10.
Or a 0.014% death rate – for CONFIRMED cases.
Stop believing the lies about what is really going on.
I was tracking excess deaths pretty closely through September. CDC publishes it but the data is retroactively updated and isn’t stable until 1-2 months have passed.
Excess deaths beyond the 1% expected increase very closely tracked to claimed COVID deaths. I was surprised. Not that I thought COVID was fake, but I did expect to uncover an inflated COVID death count because of all the politics involved.
My amateur analysis of the CDC data was that the US COVID death counts are reasonably accurate.
I still don’t trust the statistics of how many people actually died from Covid directly versus hw many side of other complications while testing positive from Covid.
Good, you are smart to.
Here’s a healthy, control data set – the US active duty military.
69,390 confirmed cases with 793 hospitalizations and … 10 deaths.
That’s right, 10.
Or a 0.014% death rate – for CONFIRMED cases.
You are right to not believe the lies about what is really going on.
Covid deaths are dramatically undercounted using any reasonable excess death analysis.
What’s in the denominator is BS and doesn’t matter. Divide the deaths by the total population and the death rate is 0.078% in the US, and 0.17% worldwide (even with the over-counting of Covid deaths).
If you don’t see the govt responses are nonsense at best, and likely criminal. Again, your silence on the WEF agenda is quite telling.
https://www.armstrongeconomics.com/international-news/disease/covid-fraud/
https://www.armstrongeconomics.com/world-news/banking-crisis/bigtech-replacing-banks/
MISH
I really think you need to break out and compare the age groups – from Canada numbers (I don’t look at US details sorry!) perspective, the really young are not impacted as much as older people for COVID-19. So if you look at the under 20 age group, I think the outcomes from flu may actually be worse than from COVID-19. This is clearly not true for over 60 age group where COVIV-19 is truly scary. This is clearly not true for over 60 age group where COVIV-19 is truly scary.
I suspect that it may depend on a countries demographics but overall I spitball that COVID-19 is 5-10 times worse but it depends on who you are wrt age and overall health.
To say it is fake or no worse than the flu is more than a little obtuse
It depends on which flu you want to talk about. The 1957-58 Flu was the worst between 1918 and now. It killed around 110K Americans. At the time the population was 175 million and was younger in composition. Correcting for the difference in population but not for a younger population gives the equivalent of 218K today. Most flu comparisons have a cut off year of around 1968. It might be oversight but it might also be because it doesn’t fit the narrative. If you want to compare flu pandemics it would be more honest to compare all of them and not just the ones you want. Don’t take my word for it. Take the Nation Institute of Health’s word. This study came out the year before Covid-19.
https://elemental.medium.com/us-covid-19-deaths-compared-to-diseases-pandemics-wars-2a7495a43280
The US passed the per capita equivalent of 1957-58 flu at 220,000, about a month ago. That doesn’t include the excess deaths likely due to Covid. With another 7 weeks to go this year, the official death with reach 300,000 in 2020. Let’s hope the vaccine is near.
Covid vs Flu? Scroll down to the image at this URL:
It’s a picture of deaths in the US over time, starting January 2017. Kind of a sine wave with peaks in the winter. Clearly shows the effect of, presumably, C19 this year.
BTW, I get the impression the winter-ish peaks every year are called, “the flu”.
More deaths are good. Deaths steal money from the hospitals and drug companies that keep people alive way beyond what is reasonable. So death can be a positive for the world.
And more positive is that death can free up inheritance money, allowing that money to filter back into the economy, thus helping us recover the Covid.
The death numbers are really quite small against total population. Stop listening to TPTB/MSM.
Don’t worry, be happy. This will all work out in the end. I’m off for my nose outside my mask workout. See ya…
If it is a claim made by Trump, his supporters, conservatives or conspiracy theorists, then it guaranteed to be false.
Trump argued the sky was not blue today in court.
https://img.thedailybeast.com/image/upload/c_crop,d_placeholder_euli9k,h_1439,w_2560,x_0,y_175/dpr_1.5/c_limit,w_908/fl_lossy,q_auto/v1605810994/GettyImages-1229683394_s9pjyp
… while his lawyer cried black ear tears.
Dang it: https://images.foxtv.com/static.fox5ny.com/www.fox5ny.com/content/uploads/2020/11/764/432/rudy6.jpg?ve=1&tl=1
LOL ROTFL! That failing little goblin.
Both the flu and Covid can only kill you once, so…. checkmate libs!