
Following a strong April, IP posts a small gain in May.
Please consider the Fed’s Industrial Production and Capacity Utilization report for May 2026.
Industrial production (IP) edged up 0.1 percent in May after rising 0.9 percent in April. Manufacturing output was unchanged in May after increasing 0.7 percent in April. In May, the index for mining rose 1.3 percent, and the index for utilities decreased 0.4 percent. At 102.6 percent of its 2017 average, total IP in May was 1.7 percent above its year-earlier level. Capacity utilization edged up to 76.2 percent, a rate that is 3.2 percentage points below its long-run (1972–2025) average.
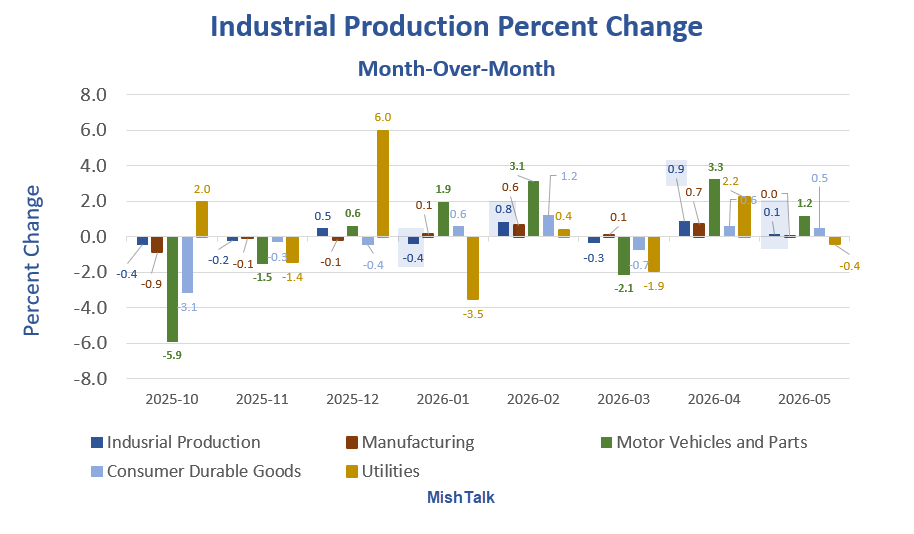
Month-Over-Month Industrial Production
- Production: +0.1 percent
- Manufacturing: +0.0 percent
- Motor Vehicles and Parts: +1.2 percent
- Consumer Durable Goods: +0.5 percent
- Utilities: -0.4 percent
Industrial Production Year-Over-Year

Utilities are on a near-continual tear, consumer durable goods are in a constant state of disaster, Motor vehicles and parts swing wildly, and manufacturing has mostly stabilized at small positives since January 2025.
Industrial Production Detail

The index details highlight how manufacturing weakness and Utilities strength.
Manufacturing peaked right at the onset of the Great Recession at 106.6. Its highest rebound just prior to the Covid recession was102.0.
The Manufacturing index has been rising lately but sits at an anemic 98.6 now, down 7.7 percent in the past 19 years.
Related Posts
June 15, 2026: Three Reasons the Price of Oil May Have Bottomed Despite a Deal
West Texas Oil is down another 5 percent to $80.52. Brent is $83.27. Still looking lower?
June 15, 2026: Core CPI Inflation Looks Contained. It’s a Mirage Ignoring Services
Let’s discuss goods and services. The latter is 63.4 percent of the CPI.


2008 was the year the demographic death spiral became real. That was the year the oldest baby boomers, born in 46, hit age 62 and the youngest boomers born in 64, turned 40. The classic pig in a python.
Take a look at the labor participation rate chart.
https://fred.stlouisfed.org/series/CIVPART/
The pattern and link is all there: demographics -> debt -> debauchery -> destiny -> death. That’s when I started my exit strategy planning because back then I knew what would be coming and here we are but just wait tin 2030 and it will become more clear and real.
That labor participation rate chart crystalized the death spiral very nicely, it will continue to go down. The inverse, chart of the social security snapshot ballooning to the moon, is the other end of the misery piece.
Got exit strategy?