
BLS Jobs Statistics at a Glance
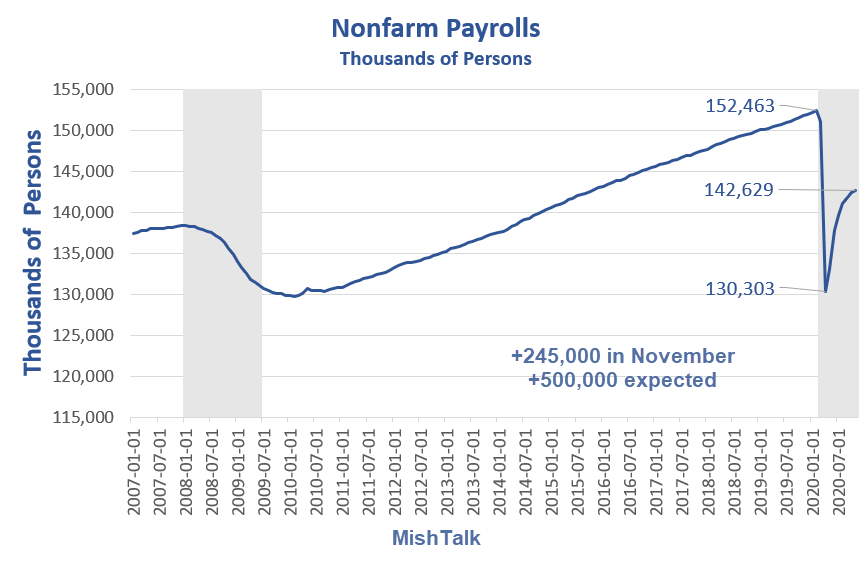
The BLS reports total nonfarm payroll employment rose by 245,000 in November and the unemployment rate
edged down to 6.7 percent.
The Bloomberg Econoday consensus was 500,000 jobs. ADP estimated 307,000 jobs.
Details from the monthly BLS Employment Report.
- Nonfarm Payroll: +245,000 to 142,629,000 – Establishment Survey
- Employment: -74,000 to 149,732,000– Household Survey
- Unemployment: -326,000 to 10,735,000- Household Survey
- Baseline Unemployment Rate: -0.2 to 6.7% – Household Survey
- U-6 unemployment: -0.1 to 12.0% – Household Survey
- Civilian Non-institutional Population: +160,000 to 261,085,000
- Civilian Labor Force: -400,000 to 160,467,000 – Household Survey
- Not in Labor Force: +560,000 to 100,618,000 – Household Survey
- Participation Rate: -0.2 to 61.5% – Household Survey
Initial Reaction
Actual employment fell by 74,000. The unemployment rate declined because another 400,000 people dropped out of the labor force.
BLS Error Rate
For March through September, BLS published an estimate of what the unemployment rate would have been had misclassified workers been included among the unemployed. Repeating this same approach, the overall October unemployment rate would have been 0.4 percentage point higher than reported. However, this represents the upper bound of our estimate of misclassification and probably overstates the size of the misclassification error.
According to usual practice, the data from the household survey are accepted as recorded. To maintain data integrity, no ad hoc actions are taken to reclassify | survey responses.
I strongly question the accuracy of the BLS assertion that 0.4% is the high end of their error rate.
Also note the rise this month to 0.4% from 0.3% last month. This is the first increase in many months.
Job Revisions
- The change in total nonfarm payroll employment for September was revised up by 39,000,
from +672,000 to +711,000 - The change for October was revised down by 28,000, from
- +638,000 to +610,000.
- With these revisions, employment in September and October combined
was 11,000 more than previously reported.
Part-Time Jobs
- Involuntary Part-Time Work: -23,000 to 6,660,000
- Voluntary Part-Time Work: -786,000 to 18,635,000
- Total Part-Time Work: -779,000 to 25,384,000
- Total Full-Time Work: +752,000 to 124,345,000
Employment Reporting Silliness
These numbers never add up correctly. I list them as reported.
Unemployment Rate – Seasonally Adjusted – Long Term

Nonfarm Payrolls Month-Over-Month

That chart is from the BLS. The title is inaccurate.
The chart represents jobs, from the Establishment Survey. Employment comes from the Household Survey.
Of the 145,000 transportation and warehousing jobs, couriers and messengers
accounted for 82,000 and warehousing and storage for +37,000.
Nonfarm Payrolls
The lead chart puts a much needed perspective on the recovery.
- Jobs are up 12,326,000 from the lows.
- Jobs are still 9,834,000 from the pre-covid highs
Hours and Wages
Average weekly hours of all private employees was flat at 34.8 hours. Average weekly hours of all private service-providing employees fell 0.1 hours to 33.7 hours. Average weekly hours of manufacturers fell 0.2 hours to at 40.3 hours.
Average Hourly Earnings of All Nonfarm Workers rose $0.09 to $29.58.
Year-over-year, wages rose from $28.34 to $29.58. That’s a gain of 4.4%.
The month-to-month and especially year-over-year gains are very distorted because more higher-paid workers kept their jobs than lower-paid employees.
Average hourly earnings of Production and Supervisory Workers rose $0.07 to $24.87.
In August, I reported “Average hourly earnings of Production and Supervisory Workers rose $0.18 to $24.81.” We are now a 6 cents ahead of August.
Year-over-year, wages rose from $23.81 to $24.87. That’s a gain of 4.5%.
For a discussion of income distribution, please see What’s “Really” Behind Gross Inequalities In Income Distribution?
Birth Death Model
Starting January 2014, I dropped the Birth/Death Model charts from this report.
For those who follow the numbers, I retain this caution: Do not subtract the reported Birth-Death number from the reported headline number. That approach is statistically invalid.
BLS Covid-19 Statement on the Birth-Death Model
The widespread disruption to labor markets due to the COVID-19 pandemic and the potential impact to the birth-death model have prompted BLS to both revisit research conducted in the aftermath of the Great Recession (2008-2009) and incorporate new ideas to account for changes in the number of business openings and closings. Two areas of research have been implemented to improve the accuracy of our birth-death model in the CES estimates. These adjustments will better reflect the net effect of the contribution of business births and deaths to the estimates. These two methodological changes are the following:
1: A portion of both reported zeros and returns from zero in the current month from the sample were used in estimation to better account for the fact that business births and deaths will not offset.
2: Current sample growth rates were included in the net birth-death forecasting model to better account for the changing relationships between business openings and closings.
BLS will determine on a monthly basis if the adjusted birth-death model described here continues to be necessary. We will disclose these changes each month in the Employment Situation news release. All months in the tables of net birth-death forecasts on this page include footnotes for any month in which a regressor was used to supplement the forecasts.
The Birth-Death model is essentially garbage but we likely will not find how distorted this is until the annual revisions next year.
Table 15 BLS Alternative Measures of Unemployment

Table A-15 is where one can find a better approximation of what the unemployment rate really is.
The official unemployment rate is 6.7%. However, if you start counting all the people who want a job but gave up, all the people with part-time jobs that want a full-time job, all the people who dropped off the unemployment rolls because their unemployment benefits ran out, etc., you get a closer picture of what the unemployment rate is. That number is in the last row labeled U-6.
U-6 is much higher at 12.0%. Both numbers would be way higher still, were it not for millions dropping out of the labor force over the past few years.
Some of those dropping out of the labor force retired because they wanted to retire. The rest is disability fraud, forced retirement, discouraged workers, and kids moving back home because they cannot find a job.
Strength is Relative
It’s important to put the jobs numbers into proper perspective.
In the household survey, if you work as little as 1 hour a week, even selling trinkets on eBay, you are considered employed.
In the household survey, if you work three part-time jobs, 12 hours each, the BLS considers you a full-time employee.
In the payroll survey, three part-time jobs count as three jobs. The BLS attempts to factor this in, but they do not weed out duplicate Social Security numbers. The potential for double-counting jobs in the payroll survey is large.
Household Survey vs. Payroll Survey
The payroll survey (sometimes called the establishment survey) is the headline jobs number, generally released the first Friday of every month. It is based on employer reporting.
The household survey is a phone survey conducted by the BLS. It measures unemployment and many other factors.
If you work one hour, you are employed. If you don’t have a job and fail to look for one, you are not considered unemployed, rather, you drop out of the labor force.
Looking for jobs on Monster does not count as “looking for a job”. You need an actual interview or send out a resume.
These distortions artificially lower the unemployment rate, artificially boost full-time employment, and artificially increase the payroll jobs report every month.
Recovery Will Take Years
The economy has added 12.3 million jobs since the April lows.
However, jobs remain 9.8 million jobs below the February 2020 peak. Millions of those jobs will not return.
The improvements are welcome but huge headwinds remain.
The falling work hours for manufacturing and service employees is another warning sign of economic weakness.
This recovery will take years.
Mish


A great way to earn money without having a job is investing, buying and selling cryptocurrencies like Bitcoin and in sites like http://www.mintme.com you can manage your accounts in a very easy way
Speaking from personal experience with our tree service business.. while white collar job growth may be weak, we continue to have a need and search for quality, service-based employees to handle our increased customer count. Reading about how many young adults are moving back home because they can’t find work is sometimes baffling to us since we struggle to find good help. With the shift we’re seeing in the workforce today, it might make sense for job seekers to adjust their skillsets to match where the job demand is high (i.e. serviced based, skilled laborers). And there is good money to be made for those who are willing to work hard. https://www.sanantoniotreeservicepros.com/
I guess if everyone gave up wanting a job and got helicopter money our unemployment rate would be 0%.
Free money (UBI or welfare) makes people dependent and takes away dignity. Suggest a guaranteed jobs program. Lots of meaningful work out there that private sector is not suited for.
From my local Connecticut community newspaper: The Connecticut Restaurant Association reported the 5 major food distributors experienced 18 to 24% accounts closed due to COVID. That translates into an estimated 600 restaurants. Further lock-downs could force up more than 1000 places to close.
Wow, thanks for so assiduously compiling these numbers. We will know why the unemployment rate goes to -3% in a few years once the manipulation gets even more insane.
So then what is the best way to address long term unemployment?
Could a federal job guarantee program help get people doing something meaningful and act a safety valve to soak up excess labour supply and put a floor under wages?
End the Fed and get the government out of the marketplace.
I’m not sure how reducing government’s role further will solve?? The pandemic job losses were not caused by government action, and could weigh economy down for years. Jobs that do come back will not provide same living standards and opportunities. A good formula for continuing social unrest….
IM SHOCKED! https://www.statnews.com/2020/12/03/how-rich-and-privileged-can-skip-the-line-for-covid19-vaccines/
The filthy poors can just go die. In the rain.
What’s the point of having all that money if it doesn’t buy entitlement? /sarc
I guess I’d say employment is better than it could be, considering COVID is kicking our butt at the moment.
But….I just can’t help bu think we have another shoe to drop….with some serious defaults ahead….
That might not make much difference in stocks….but it sure could in real estate.
Defaults? Nuttin the Fed Reserve can’t handle! By the way, former Fed Chair Yellen may by our Treasurer in a little while, so we will be in good hands. She’s a female, too, in case you didn’t know!
Just think of Yellen as Santa Claus in Ayn Rand drag.
California is basically shutting down in a few days. The fecal missile is accelerating toward the rotary air displacement device.
Nobody in government has lost a job, missed a paycheck or had any pay or benefits reduced. “We’re all in this together!” ©
All the more reason we should all work for the government, so that we will always have a job!
Or has that been tried somewhere?
I think the public sector (Government jobs) pay more that 25% more than private jobs plus you get health care and a pension.
The mantra used to be you were paid less to be civil servant but now you get paid more and are probably on the average middle to upper middle class
Do you even know how to read?
Look again at the chart of emploment by sector…
99,000 down in goverment
Of the 145,000 transportation and warehousing jobs, couriers and messengers accounted for 82,000 and warehousing and storage for +37,000.
WASHINGTON (Reuters) – The U.S. economy added the fewest workers in six months in November, hindered by a resurgence in new COVID-19 cases that, together with a lack of more government relief money, threatens to reverse the recovery from the pandemic recession.
“This is a disappointing report, and one that shows the third wave of the pandemic is having a bigger effect on hiring than had been thought,” said Brad McMillan, chief investment officer for Commonwealth Financial Network. “Prospects for a continued strong recovery in consumer spending may be at risk. This is a wake-up call for the Congress and should support more Federal stimulus.”