
Econoday Consensus
The Econoday consensus was 875,000 units in a range of 820,000 to 950,000 unit.
The Census Bureau’s New Residential Sales report provides a regional breakdown.
Sales by Region SAAR
- Northeast: 42,000
- Midwest: 99,000
- South: 636,000
- West: 242,000
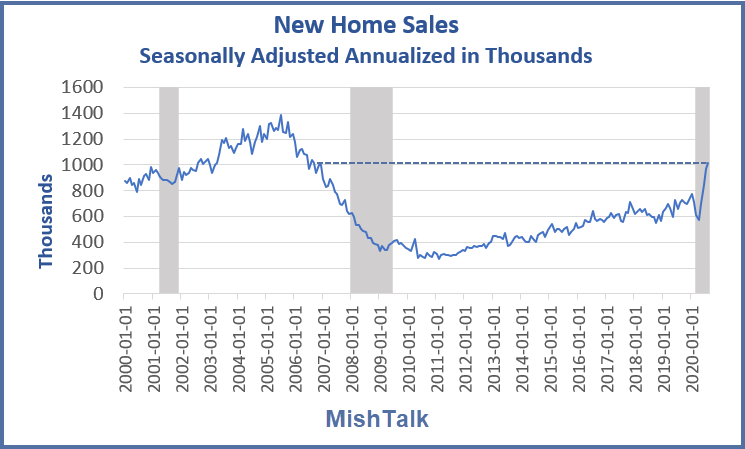
New Home Sales 1963-Present

Seasonal Adjustments Distortions
It’s important to understand seasonal adjustment distortions. New home sales for the month were 83,000 units, the same as last month.
Sales in the normally busy months of April and May instead happened in July and August making for mammoth adjustments.
The impact especially shows up year over year where sales were up an amazing 43.2 percent from last August.
Actual Number of New Homes Sold in August
- Northeast: 4,000
- Midwest: 9,000
- South: 52,000
- West: 19,000
- Total: 83,000
83,000 in actual sales is reported as 1,011,000 new homes sold.
Year-to-Date Comparisons

Year-to-date actual sales were at this level in the mid 1980s and were higher in the late 1970s.
Sales were also higher between 1996 and 2006. Population-adjusted, these sales don’t really stack up.
New home sales are having a very good year. However, the above chart puts a badly needed perspective on things.
Existing Home Sales at Highest Level in 14 Years
Also note Existing Home Sales at Highest Level in 14 Years. But once agaain, seasonal distortions annualized are in play.
Mish


I don’t get it – why not just count them? What is the purpose of “seasonally adjusting” sales?
I usually look you to answer MY questions….but I’ll bite on this.
An economic time series is a sequence of successive measurements of an economic activity (that is, variable) obtained at regular time intervals (such as every month or every quarter). The data must be comparable over time, so they must be consistent in the concept being measured and the way that concept is measured.
Seasonal adjustment is the process of estimating and removing seasonal effects from a time series in order to better reveal certain non-seasonal features. Examples of seasonal effects include a July drop in automobile production as factories retool for new models and increases in heating oil production during September in anticipation of the winter heating season.(Seasonal effects are defined more precisely in 5. and 6. below.) Sometimes we also estimate and remove trading day effects and moving holiday effects (see 7. below) during the seasonal adjustment process.
Seasonal movements are often large enough that they mask other characteristics of the data that are of interest to analysts of current economic trends. For example, if each month has a different seasonal tendency toward high or low values it can be difficult to detect the general direction of a time series’ recent monthly movement (increase, decrease, turning point, no change, consistency with another economic indicator, etc.). Seasonal adjustment produces data in which the values of neighboring months are usually easier to compare. Many data users prefer seasonally adjusted data because they want to see those characteristics that seasonal movements tend to mask, especially changes in the direction of the series.
This difference in direction can happen only when the seasonal factor for April is larger than the seasonal factor for March, indicating that when the underlying level of the series isn’t changing, the April value will typically be larger than the March value. This year, the original series’ April increase over the March value must be smaller than usual, either because the underlying level of the series is decreasing or because some special event or events abnormally increased the March value somewhat, or decreased the April value somewhat. (When trading day or moving holiday effects are present and are being adjusted out, other explanations are possible.)
Seasonal adjustment procedures for monthly time series estimate effects that occur in the same calendar month with similar magnitude and direction from year to year. In series whose seasonal effects come primarily from weather (rather than from, say, Christmas sales or economic activity tied to the school year or the travel season), the seasonal factors are estimates of average weather effects for each month, for example, the average January decrease in new home construction in the Northeastern region of the U.S. due to cold and storms. Seasonal adjustment does not account for abnormal weather conditions or for year-to-year changes in weather. It is important to note that seasonal factors are estimates based on present and past experience and that future data may show a different pattern of seasonal factors.
Its called inflation
The K shaped “recovery” continues.
Low interest rates and people cooped up deciding a bigger home made sense
I just looked at the Texas data……. and Dallas and Houston are leading in new home sales…..they both turned up last December and have been headed higher ever since….not even a COVID dip in April.
Pretty wild.
Joe Rogan moved to Austin……I think he lives just across the freeway from me…but that’s a rumor…unsubstantiated as of yet.
“Joe Rogan moved to Austin”
I’m guessing he qualified for a MMJ card. Tejas is serious about that stuff, no?
Here, the only kind of legal medical pot is CBD oil. Joe will have to outsource the cannabis if he fires up with Elon Musk in his new digs.
In Texas we do not approve of dope that actually gets people high. It’s very dangerous. Haven’t you seen Reefer Madness?
LOL!
Rumor confirmed. I’m a Joe Rogan fan, but I doubt I’ll get invited to any parties over there.