
This morning the BLS released its report on the Producer Price Index for December 2019.
Key PPI Points
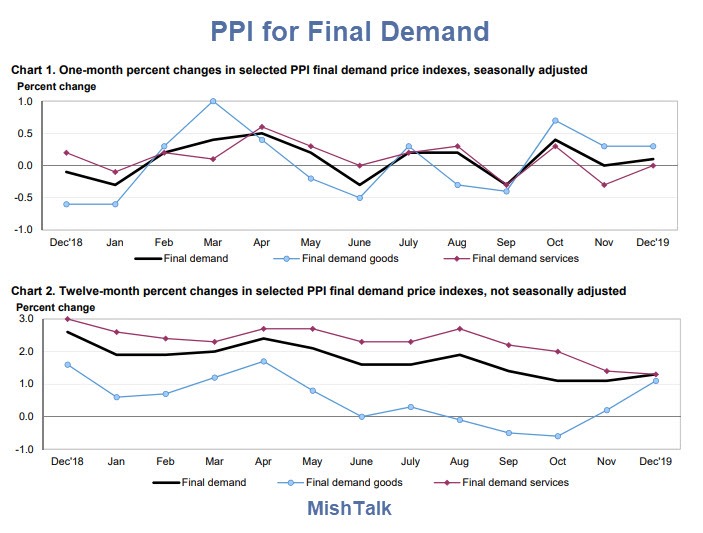
- The Producer Price Index for final demand edged up 0.1 percent in December, seasonally adjusted. On an unadjusted basis, the final demand index moved up 1.3 percent in 2019, after a 2.6-percent advance in 2018.
- The December increase in the final demand index was the result of a 0.3-percent rise in prices for final demand goods. The index for final demand services was unchanged.
- Prices for final demand less foods, energy, and trade services inched up 0.1 percent in December following no change in November. In 2019, the index for final demand less foods, energy, and trade services climbed 1.5 percent after advancing 2.8 percent in 2018.
Final Demand Goods: The index for final demand goods rose 0.3 percent in December, the same as in November. Most of the increase in December can be traced to a 1.5-percent advance in prices for final demand energy. The index for final demand goods less foods and energy edged up 0.1 percent. In contrast, prices for final demand foods moved down 0.2 percent.
Final demand services: Prices for final demand services were unchanged in December following a 0.3- percent decrease in November. In December, a 2.7-percent advance in the index for final demand transportation and warehousing services offset a 0.3-percent decline in margins for final demand trade services and a 0.1-percent decrease in the index for final demand services less trade, transportation, and warehousing. (Trade indexes measure changes in margins received by wholesalers and retailers.)
Consensus
- The Econoday PPI consensus was 0.2% for the PPI and also 0.2% for the PP less food and energy. Both rose 0.1%.
- Yera over year, the Econoday consensus was 1.4% for PPI excluding food and energy vs a reported measure of 1.1%.
Crude Daily Chart

Despite a 21% rise in the price of crude between October 1 and December 31, the PPI could gain no traction.
Crude Monthly Chart
Crude finished 2019 roughly 38% higher than the start of the year. But there was a plunge 44% plunge between October 2017 and the December 2017 low.
Little Pass Through
Other than energy, there has been little commodity inflation at the producer level. And services have had no traction since of July of 2019.
Mike “Mish” Shedlock


LOL typical politburo bullshit that the sheep lap up until they see the king has no clothes.
Dang, hardly any inflation in the US? Mr. Fed will not be pleased. But for the rest of us? (there is Festivus).
“serenity now!”
The trend is your friend.
Latest Monthly Wholesale Trade report – total durable/non durable
sales … y/y (november) … +0.8%
inventories … y/y (november) … +3.3%
And with ANY sand in the gears cough Boeing cough …
The Fed will not be pleased by this news.
Thus, the obvious conclusion they will draw from this is that interest rates are not low enough and their balance sheet has room to grow.
Exactly.
Promoting even greater wealth/income disparity is the solution for, umm, elevated wealth/income disparity … I, uh, guess …