
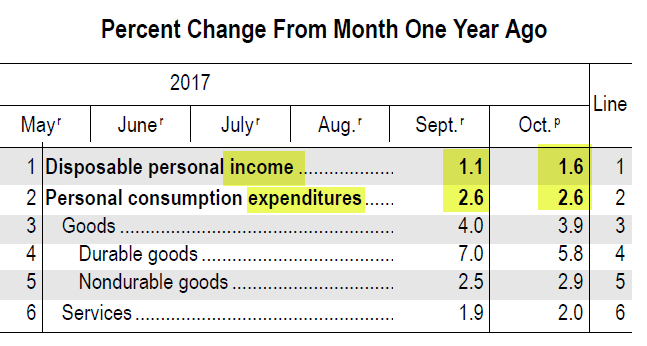
The BEA’sIncome and Outlays Reportshows consumers have been tapping savings all year to support purchases.
Consumers spent 2.6% more than a year ago. Incomes are up only 1.6% from a year ago. That pattern has repeated every month in the above table.
Real Disposable Income

Savings Rate

The numbers reflect averages. Those on the low end of the economic scale spend every penny they make, and then some.
In a related article, also consider Hurricane Impacts Abate: Real Income +0.3%, PCE +0.1%, Inflation +0.1%.
Mike “Mish” Shedlock


Someplace there are numbers on savings and credit cards debt. Modestly earlier this year, I saw a claim that the savings rate was down, but still positive, around if I recall correctly +5%. I do not recall what this was a percentage of.
“The BEA’s Income and Outlays Report shows consumers have been tapping savings all year to support purchases.” Have consumers been tapping savings or tapping credit cards?
Curiously, income tax withholding (see the NDD post on bonddad.blogspot.com every Saturday) has allegedly been going up around 3-5% YoY, e.g. http://community.xe.com/blog/xe-market-analysis/weekly-indicators-yield-curve-flatter-still-positive-edition . There are large week-to-week fluctuations. I have no explanation.