
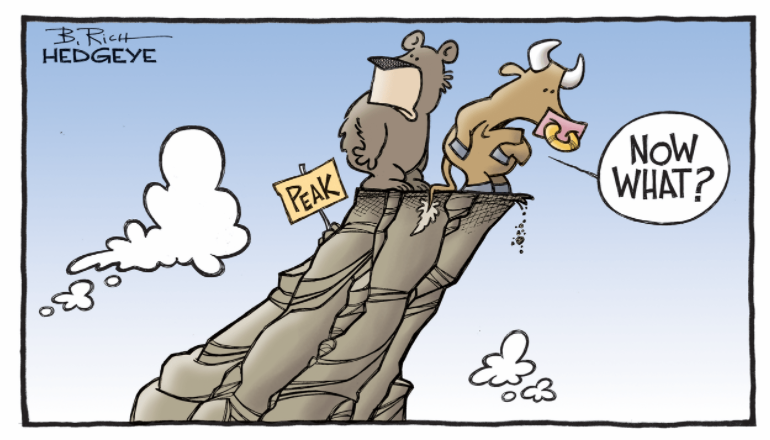
“Year-over-year GDP growth of +2.9% should be the peak of the cycle for the USA,” tweeted Keith McCullough this morning. “That’s our call and we’re sticking to it.”

I am not quite sure what HedgEye means by “cycle”. I see higher year-over-year gains.
Draghi Blames the Weather
No Bubble in Wages
Peak Confidence in Government?
Officially Admitted Nonperforming Loans in China
What’s the real story?
Mike “Mish” Shedlock


I actually did not do any math there. I just explained to you how to interpret charts correctly.
Your math is faulty but I actually have a life to lead so cannot continue this. I’m a big believer personal freedom and you are free to believe whatever you like. Good luck.
Actually Wilshere 5000 did not increase 14x from 1985-2002 (the period I referred to). It increased only 7x. Just like you need to match nominal with nominal you also need to match periods when comparing wages and assets. The nominal wages have actually increased more than 2x from 1985-2018 when Wilshere increased those 14x that you used as a reference.
Can I suggest that accessibility to stock market has made people to switch to asset that are earning income instead of assets like gold? And perhaps it can explain to some extent this trend of higher stock valuations?
Of course, agreeably, stock prices are high right now according to CAPE ratio , but the OccupyWisdom chart would make one incorrectly think that Wilshere 5000 would have to nominally fall 6x to “get back to normal” with the incorrectly used lagging real wages. How about falling only 2 times to “get back to normal” with lagging nominal wages?
Isn’t there a huge difference between 6x vs 2x?
“What’s the real story?” That which they aren’t telling us. Junker said that when it is serious, they have to lie.
“Peak Confidence in Government?” Didn’t that boat sail a long time ago? Government has made housing unaffordable, education unaffordable and medical unaffordable, not to mention made government pensions unaffordable.
So, if we look at nominal versus nominal that changes everything does it? The Wilshere 5000 is ~14x its 1985 level while the nominal wage is under 2x. No, you’re right that looks about even :/
“Making predictions is really hard, especially when they’re about the future” ~ Berra.
https://www.telegraph.co.uk/business/2018/04/27/uk-economy-grinds-halt-gdp-growth-falls-five-year-low/ It’s even worse in the UK with 0.1% growth last quarter. It’s not much better in Draghi land. https://www.telegraph.co.uk/business/2018/04/27/whole-world-slowing-europe-just-vulnerable-britain/
@Mish why did you repost OccupyWisdom who is comparing “Real wages” with “Nominal asset prices” to create attention screaming chart?
You compare nominal with nominal. And real with real. You never compare nominal with real.
The nominal wage chart looks more like this –
https://pbs.twimg.com/media/Db2wF3GWkAEEVVs.jpg – sorry did not have a time to find better chart. As can be seen nominal wages from 1985 to 2002 increased almost by a factor of 2.
Good one! But I thought the rule was triple it. That goes for China too!
They aren’t looking in the right places, sure there is a hotel tax, but not a service tax and service workers who have the highest rate of inflation. Alternately if you receive a free service, meals on wheels, or something, they should count that. The point is that nonprofits do a lot of the heavy lifting in this economy, they should at least count it, even if they don’t tax it, and then they can say at some point in the future we need to improve revenues in the interest of tax fairness lets consider this. There is really nothing wrong with this economy just economists stuck with the same data they used in the 1960s. The service sector is growing the fastest, I realize that Tax and Spend is what government does, lately they just forgot the first part
Asking China for official stats on non-performing loans is like asking a woman how many guys she slept with, whatever the number, double it.