
BLS Jobs Statistics at a Glance
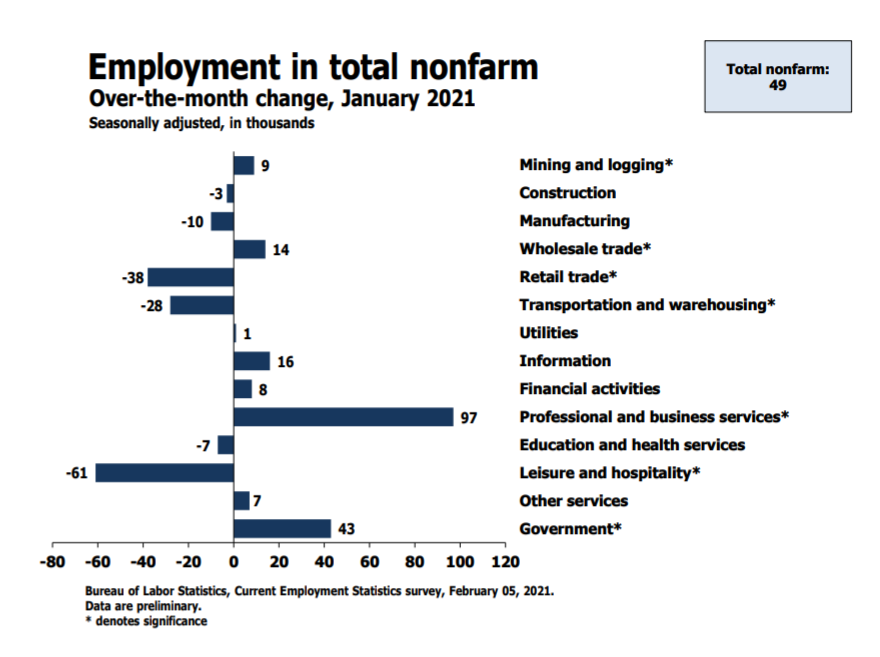
The BLS reports total nonfarm payroll employment rose by a meager 49,000 in January. Private payrolls only gained 6,000. Manufacturing lost 10,000 jobs.
The Bloomberg Econoday consensus was an increase of 50,000 jobs. ADP estimated a gain of 174,000 private jobs, missing the mark pretty badly.
Details from the monthly BLS Employment Report.
- Nonfarm Payroll: +49,000 to 142,631,000 – Establishment Survey
- Employment: +201,000 to 150,031,000– Household Survey
- Unemployment: -606,000 to 10,130,000- Household Survey
- Baseline Unemployment Rate: -0.4 to 6.3% – Household Survey
- U-6 unemployment: -0.6 to 11.1% – Household Survey
- Civilian Non-institutional Population: -379,000 to 260,851,000
- Civilian Labor Force: -406,000 to 160,161,000 – Household Survey
- Not in Labor Force: +27,000 to 100,690,000 – Household Survey
- Participation Rate: -0.1 to 61.4% – Household Survey
Initial Reaction
Payrolls are little changed for three months. In fact, they are down from the November recovery peak of 142,809,000 to 142,631,000 in January.
Yet, the unemployment rate plunged. How did this happen?
The Labor Force declined by 406,000. Also note the population normally rises month-to-month but instead it fell by 379,000.
The BLS made this notice today: “Household survey data for January 2021 reflect updated population estimates.”
Couple the labor force decline with a modest rise in employment (not jobs) and you have a big dip in the unemployment rate.
BLS Error Rate
Since March 2020, household survey interviewers have been instructed to classify employed persons absent from work due to temporary, pandemic-related business closures or cutbacks as unemployed on temporary layoff. As in earlier months, some workers affected by the pandemic who should have been classified as unemployed on temporary layoff were instead misclassified as employed but not at work. However, the share of responses that may have been misclassified was highest in the early months of the pandemic and has been considerably lower in recent months. For March through December, BLS published an estimate of what the unemployment rate might have been had misclassified workers been included among the unemployed. Repeating this same approach, the seasonally adjusted January unemployment rate would have been 0.6 percentage point higher than reported. However, this represents the upper bound of our estimate of misclassification and probably overstates the size of the misclassification error.
According to usual practice, the data from the household survey are accepted as recorded. To maintain data integrity, no ad hoc actions are taken to reclassify survey responses.
I strongly question the accuracy of the BLS assertion that 0.6% is the high end of their error rate.
Also note the rise this month to 0.6% is up from 0.3% a few months ago. The trend in the error rate has been rising.
Job Revisions
- The change in total nonfarm payroll employment for November was revised down by 72,000, from +336,000 to +264,000
- The change for December was revised down by 87,000, from -140,000 to -227,000.
- With these revisions, employment in November and December combined was 159,000 lower than previously reported.
Part-Time Jobs
- Involuntary Part-Time Work: -216,000 to 5,954,000
- Voluntary Part-Time Work: +282,000 to 18,519,000
- Total Part-Time Work: +301,000 to 24,627,000
- Total Full-Time Work: -292,000 to 124,990,000
Employment Reporting Silliness
These numbers never add up correctly. I list them as reported.
Unemployment Rate – Seasonally Adjusted

Nonfarm Payrolls

The above chart puts a much needed perspective on the recovery.
- Jobs are up 12,470,000 from the lows.
- Jobs are still 9,892,000 from the pre-covid highs
Hours and Wages
Average weekly hours of all private employees rose by 0.3 hours to 35.0 hours. Average weekly hours of all private service-providing employees rose by 0.2 hours to 33.9 hours. Average weekly hours of manufacturers rose by 0.3 hours to 40.4 hours.
Those increases are artifacts of declining labor force.
Average Hourly Earnings of All Nonfarm Workers rose $0.06 to $29.90.
Year-over-year, wages rose from $28.43 to $29.96. That’s a gain of 5.4%.
The month-over-month and year-over-year gains are very distorted because more higher-paid workers kept their jobs than lower-paid employees.
Average hourly earnings of Production and Supervisory Workers rose $0.03 to $25.18.
Year-over-year, wages rose from $23.88 to $25.18. That’s a gain of 5.4%.
Again, these numbers are hugely distorted as more lower wage workers lost their jobs than higher ones.
For a discussion of income distribution, please see What’s “Really” Behind Gross Inequalities In Income Distribution?
Birth Death Model
Starting January 2014, I dropped the Birth/Death Model charts from this report.
For those who follow the numbers, I retain this caution: Do not subtract the reported Birth-Death number from the reported headline number. That approach is statistically invalid.
BLS Covid-19 Statement on the Birth-Death Model
The widespread disruption to labor markets due to the COVID-19 pandemic and the potential impact to the birth-death model have prompted BLS to both revisit research conducted in the aftermath of the Great Recession (2008-2009) and incorporate new ideas to account for changes in the number of business openings and closings. Two areas of research have been implemented to improve the accuracy of our birth-death model in the CES estimates. These adjustments will better reflect the net effect of the contribution of business births and deaths to the estimates. These two methodological changes are the following:
1: A portion of both reported zeros and returns from zero in the current month from the sample were used in estimation to better account for the fact that business births and deaths will not offset.
2: Current sample growth rates were included in the net birth-death forecasting model to better account for the changing relationships between business openings and closings.
BLS will determine on a monthly basis if the adjusted birth-death model described here continues to be necessary. We will disclose these changes each month in the Employment Situation news release. All months in the tables of net birth-death forecasts on this page include footnotes for any month in which a regressor was used to supplement the forecasts.
The Birth-Death model is essentially garbage but we likely will not find how distorted this is until the annual revisions next year.
Table 15 BLS Alternative Measures of Unemployment

Table A-15 is where one can find a better approximation of what the unemployment rate really is.
The official unemployment rate is 6.3%. However, if you start counting all the people who want a job but gave up, all the people with part-time jobs that want a full-time job, all the people who dropped off the unemployment rolls because their unemployment benefits ran out, etc., you get a closer picture of what the unemployment rate is. That number is in the last row labeled U-6.
U-6 is much higher at 11.1%. Both numbers would be way higher still, were it not for millions dropping out of the labor force over the past few years.
Some of those dropping out of the labor force retired because they wanted to retire. The rest is disability fraud, forced retirement, discouraged workers, and kids moving back home because they cannot find a job.
Strength is Relative
It’s important to put the jobs numbers into proper perspective.
In the household survey, if you work as little as 1 hour a week, even selling trinkets on eBay, you are considered employed.
In the household survey, if you work three part-time jobs, 12 hours each, the BLS considers you a full-time employee.
In the payroll survey, three part-time jobs count as three jobs. The BLS attempts to factor this in, but they do not weed out duplicate Social Security numbers. The potential for double-counting jobs in the payroll survey is large.
Household Survey vs. Payroll Survey
The payroll survey (sometimes called the establishment survey) is the headline jobs number, generally released the first Friday of every month. It is based on employer reporting.
The household survey is a phone survey conducted by the BLS. It measures unemployment and many other factors.
If you work one hour, you are employed. If you don’t have a job and fail to look for one, you are not considered unemployed, rather, you drop out of the labor force.
Looking for jobs on Monster does not count as “looking for a job”. You need an actual interview or send out a resume.
These distortions artificially lower the unemployment rate, artificially boost full-time employment, and artificially increase the payroll jobs report every month.
Recovery Will Take Years
The economy has added 12.5 million jobs since the April lows.
However, jobs remain 9.9 million jobs below the February 2020 peak. Millions of those jobs will not return.
There has been no progress since November.
The improvements are welcome but huge headwinds remain.
This recovery will take years, especially airlines and travel.
Other losses are permanent due to a surge in work-at-home and online shopping (less office space and malls needed).
Mish


Comment redo….
The “U.S. BUREAU OF LABOR STATISTICS reported 6.3 on January’s unemployment rate. So how do you figure Feburary at 6.7 has a drop in the unemployment rate? Makes no sense!! Actually, as of today Feb 8, 2021 the Feburary’s unemployment rate at the U.S. BUREAU OF LABOR STATISTICS website hasn’t even been released as of yet! So where is your report coming from again, couldn’t be BLS? Feel free to check for yourself.
The “U.S. BUREAU OF LABOR STATISTICS reported 6.3 on January’s unemployment rate. So how do you figure Feburary at 6.3 has a drop in the unemployment rate? Makes no sense!! Actually, as of today Feb 8, 2021 the Feburary’s unemployment rate at the U.S. BUREAU OF LABOR STATISTICS website hasn’t even been released as of yet! So where is your report coming from? Feel free to check for yourself.
The number of people in the labor force and the participation rate will both go up once all the illegal immigrants are made legal and can be counted. I don’t know but we could add another 8 to 10 million that will be counted in the labor force and almost none of them will be counted as unemployed? Afterall you have to have had a job and let go to be counted as unemployed?
“The widespread disruption to labor markets due to the COVID-19 pandemic…”
The disruption to labor markets was due to state governments shutting down their economies. Disney World is open and has been for months. Disneyland is still shut down. Never before has the economy been shut down for a pandemic. Governments are responsible for this economic mess, not the virus.
Governor Newsom shut down outdoor dining this winter without any scientific justification. Newsom also refused to release the data and method to his reasoning for restrictions, saying that the public was too stupid to understand it.
Of course manufacturing jobs are down under Biden but his convict son wrote a book. LMAO China will get a bigger share of our jobs, glad I prepared for this mess.
I would wager that the economic statistics that China supplies the world are probably more truthful than the ones the US government supplies to its subjects.
For the US rulers to claim 1% inflation, when it’s closer to 8-9% is a sick joke.
And to claim 6% unemployment, when the unfudgeable labor participation rate is the lowest in history ( close to 20% real unemployment), is scandalous.
It sounds like we are back to counting those whose benefits ran out again. I always wondered what happened to theses people during the Trump era as he was touting the lowest unemployment rate ever despite the obvious problem with his claims of 93 million Americans out of work and 6 million plus jobs created in the first couple of years.
Trump never said he had the lowest unemployment EVER, he said WE have the lowest unemployment since 1969. Before covid19 hit .. https://data.bls.gov/timeseries/LNS14000000
You missed the main point. The 93 million Trump was worried about when running for president was soon forgotten as he participated in the government’s cooking of the books for his own political gain.
Most interesting stat is the fall in population. How often does that happen? I still think there will be a lot of pent up demand for entertainment, leisure, travel, etc so that part of the economy will come back strong. But will be offset by new trends toward work-at-home, less business travel, and businesses deciding this is a good time to trim the workforce. Maybe federal infrastructure spending can grease some employment wheels. Unfortunately the labor statistics are so misleading a lot of people do not realize that this is a serious problem.
Well, my wife counts as someone who has dropped out of the labor force.
At age 62, she was working [mostly] for fun at a retailing clothing store.
Then, Covid hit and she was let go. So, she went on unemployment. Once UI benefits end, she will, at age 63.3, start collecting Social Security.
She says she will not go back to work even when the Covid collapse is over.
But, the stock market is up so who cares about working?
Correction Davebarnes2 ….The casino is up…everyone is putting their bets and here we go…
406,000….this is the number of millennials who decided to quit work, join WallStBeats and get rich quick….”Diamond hands”!!
Kidding aside, the 406K number should be factored with the 379K drop in population.
This, to me, means baby-boomers dying while millennials are not yet joining the workforce. (there’s a pandemic out there)
As to the 379K drop in population, forecasters predicted Covid would dramatically reduce 2021’s birth total by as much as 500K.
It also bears mention, automation/technology has dramatically increased during this crisis, much of which is here to stay, many jobs that have been replaced are likely gone forever.
Say, a Zoom convention or training meeting instead of the Hotel, no more quarterly conventions at the Best Western, less workers needed at the Best Western …etc….etc
Replacing certain training missions with Zoom is a great idea. The real useful ones will still be in the hotels and convention centers while the “fluffy” ones will be on Zoom and everyone will be happy because the relevant boxes will be checked.
A friend works in an area directly related to hotel conventions, incoming contracts/bids fell off a cliff this year, it’s since rebounded, but only a small fraction what it was.
They’ve laid off 70% of their workers, no need to rehire in sight.
Hotels are an excellent indicator, they have to plan ahead…you can’t just pitch tents for conventions if you don’t have capacity.
This tells us reservations aren’t rebounding for future events.
Probably because it isn’t over yet. I think we need another year or so to see a trend.
Yeah…millennials are getting rich…and soon they will get $1,400…more to bet.
Food bank usage up 50% in the past year.
It’s ugly out there…
All that shows is that Americans like to eat.
I with they would just headline the raw numbers and not try to adjust. The adjustments is where they go awry. I understand there are seasonal factors. I.e. Christmas hiring, farm workers. But, they can just compare the numbers to the previous year. State the number of employed is X. Last year it was Y. The US population has increased by Z in the past year.
They lie to us all the time. This is just another lie among many. Remember, face rags help, so does the new vaccine. Here take a look at what we have to look forward to, with the new liar.
If anyone thinks this is over, think again. Probably 10 years of more face masks, jabs, and other BS that won’t help. Freedom gone….
PSAKI: “Even after you’re vaccinated, social distancing and wearing masks will be essential.”
wow….Wages increased 5.4% YOY That is a very big number when the FED says inflation is 1.4% for 2020. Wages growing 3x faster than inflation.
As Mish noted, most folks didn’t see those wage increases. It’s just because the lower paid folks lost their jobs, and their lower wages didn’t get averaged in.
When was the last time the BLS revised a previous month’s unemployment figures UP instead of down?
Yeah….well, maybe next month….lol.
BLS is the master of the porcine make-over