
Initial Reaction
In January, the BLS reported the population supposedly shrunk by 649,000. Last month the jobs only rose by 20,000. This month the BLS says job gains were 196,0000. But the BLS also says employment fell by 201,000. The wild fluctuations continue.
Job Revisions
The change in total nonfarm payroll employment for January was revised up from +311,000 to +312,000, and the change for February was revised up from +20,000 to +33,000. With these revisions, employment gains in January and February combined were 14,000 more than previously reported. After revisions, job gains have averaged 180,000 per month over the last 3 months.
BLS Jobs Statistics at a Glance
- Nonfarm Payroll: +196,000 – Establishment Survey
- Employment: -201,000 – Household Survey
- Unemployment: -24,000 – Household Survey
- Involuntary Part-Time Work: +189,000 – Household Survey
- Voluntary Part-Time Work: +144,000 – Household Survey
- Baseline Unemployment Rate: Unchanged at 3.8% – Household Survey
- U-6 unemployment: Unchanged at 7.3% – Household Survey
- Civilian Non-institutional Population: +145,000
- Civilian Labor Force: -224,000 – Household Survey
- Not in Labor Force: +369,000 – Household Survey
- Participation Rate: -0.2 to 63.0– Household Survey
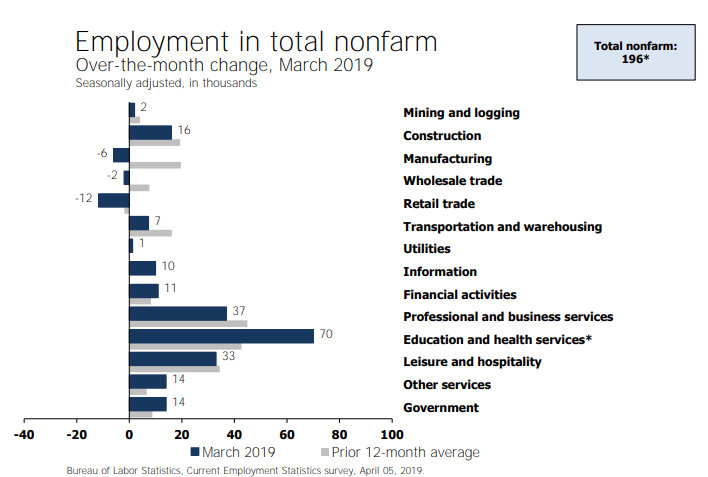
Employment Report Statement
Total nonfarm payroll employment increased by 196,000 in March, and the unemployment rate was unchanged at 3.8 percent, the U.S. Bureau of Labor Statistics reported today. Notable job gains occurred in health care and in professional and technical services.
Unemployment Rate – Seasonally Adjusted

The above Unemployment Rate Chart is from the BLS. Click on the link for an interactive chart.
Nonfarm Employment Change from Previous Month

Hours and Wages
Average weekly hours of all private employees was flat at 34.4 hours. Average weekly hours of all private service-providing employees was flat at 33.3 hours. Average weekly hours of manufacturers was flat at 40.7 hours.
Average Hourly Earnings of All Nonfarm Workers rose $0.4 to $27.70. That a 0.14% gain. Average hourly earnings of private service-providing employees rose $0.05 to $27.47, a gain of 0.18%. Average hourly earnings of manufacturers fell $0.05 to $27.38, a loss of 0.18%.
Average hourly earnings of Production and Supervisory Workers rose $0.06 to $23.24. That’s a 0.26% gain. Average hourly earnings of private service-providing employees rose $0.06 to $22.98, a gain of 0.26%. Average hourly earnings of manufacturers rose $0.02 to $21.93, a gain of 0.09%
Year-Over-Year Wage Growth
- All Private Nonfarm from $26.84 to $27.70, a gain of 3.2%
- All production and supervisory from $22.49 to $23.24, a gain of 3.3%.
For a discussion of income distribution, please see What’s “Really” Behind Gross Inequalities In Income Distribution?
Birth Death Model
Starting January 2014, I dropped the Birth/Death Model charts from this report. For those who follow the numbers, I retain this caution: Do not subtract the reported Birth-Death number from the reported headline number. That approach is statistically invalid. Should anything interesting arise in the Birth/Death numbers, I will comment further.
Table 15 BLS Alternative Measures of Unemployment

Table A-15 is where one can find a better approximation of what the unemployment rate really is.
Notice I said “better” approximation not to be confused with “good” approximation.
The official unemployment rate is 3.8%. However, if you start counting all the people who want a job but gave up, all the people with part-time jobs that want a full-time job, all the people who dropped off the unemployment rolls because their unemployment benefits ran out, etc., you get a closer picture of what the unemployment rate is. That number is in the last row labeled U-6.
U-6 is much higher at 7.3%. Both numbers would be way higher still, were it not for millions dropping out of the labor force over the past few years.
Some of those dropping out of the labor force retired because they wanted to retire. The rest is disability fraud, forced retirement, discouraged workers, and kids moving back home because they cannot find a job.
Strength is Relative
It’s important to put the jobs numbers into proper perspective.
- In the household survey, if you work as little as 1 hour a week, even selling trinkets on eBay, you are considered employed.
- In the household survey, if you work three part-time jobs, 12 hours each, the BLS considers you a full-time employee.
- In the payroll survey, three part-time jobs count as three jobs. The BLS attempts to factor this in, but they do not weed out duplicate Social Security numbers. The potential for double-counting jobs in the payroll survey is large.
Household Survey vs. Payroll Survey
The payroll survey (sometimes called the establishment survey) is the headline jobs number, generally released the first Friday of every month. It is based on employer reporting.
The household survey is a phone survey conducted by the BLS. It measures unemployment and many other factors.
If you work one hour, you are employed. If you don’t have a job and fail to look for one, you are not considered unemployed, rather, you drop out of the labor force.
Looking for jobs on Monster does not count as “looking for a job”. You need an actual interview or send out a resume.
These distortions artificially lower the unemployment rate, artificially boost full-time employment, and artificially increase the payroll jobs report every month.
Final Thoughts
The past several jobs reports have had wild fluctuations. This month repeated the story but in different ways. Last month I commented: “The three month average of jobs is now +186,000 per month but the three month average in employment is only +47,000 per month.”
That discrepancy continues. For the last three months, jobs are up an average of 180,000 per month. Employment is up 54,000 per month.
Year-over-year employment went from 155,160 to 156,748. That’s an average of 132,000 per month and slowing, if the trend holds.
Mike “Mish” Shedlock


Here is evidence that ageism hasn’t really existed since the great recession. The lowest unemployment numbers are those older than 55.
I held my nose and clicked on that CNBC article, and as expected it said nothing about what sort of jobs the 55+ crowd had. The question then becomes whether we’re talking about “real” jobs, meaning salaries that support a middle class lifestyle, or the sort of part time/seasonal “get them out of the house and keep them busy” jobs we typically associate with the elderly.
Remember, with BLS stats a person working as little as one hour a week can count as full time employment, which is one of the reasons the stats are so screwed up.
Agreed. But look at the discrepancy in growth between that and the next two age groups. I’m not talking about job quality. This is more a relative measure of which age groups have jobs and which are down.
MISH: “For the last three months, jobs are up an average of 180,000 per month. Employment is up 54,000 per month.
Year-over-year employment went from 155,160 to 156,748. That’s an average of 132,000 per month”
QUESTION: Where are these “employment” numbers coming from, or how are they calculated. Mish typically includes a similar statement every month, but I have never been able to figure out where it comes from.
Not true. Ageism continues to thrwart the desires of post-55 workers to continue gainful employment. Get laid off in your 50s and you’ll learn what I mean.
50s ? Try 45. My last employer laid off me and about 100 others who were over 40. They stay just below the threshold of facing age discrimination. They turn around and hire h1bs 6 months later.
I don’t get why all the speculation about a crash and recession etc. – as if it’s a 100% sure thing. “Thursday’s report suggests the labor market remains strong, leaving businesses reluctant to let workers go” – sure don’t sound like no stinkin’ recession is coming.
Clickbait.
Which are you going to read: “We are all doomed to die” or “Things are looking OK”?
Understood. It’s just the lies are already enough is enough x 10000. Too many useful idiots out there believe the lies.
Those who are not working do not want to work. Those figures about underemployment , part time, and dropped out are not correct. Ask any employer and they will cite labor constraints as their number one problem. There is a labor shortage. My own reasoning is that people who are not working are being paid to do so and this is the result. Others may deliberately work part time to maintain their free Medicaid insurance( Obamacare). If we had universal healthcare, single payer, like the democrats want you would see a significant increase in employment.
It is more a matter of the vast amount of available jobs out there pay $10-15 per hour, that does not even pay the rent especially here in LA. Without trying to sound like a lefty there is a shortage of jobs that pay a living wage.
Maybe true to an extent. But when living in area is to expensive people move. When I was in HS you could get an autoworker job and make a lot of money with so just hard work and no real skills. Unfortunately those days are gone. Low skill low pay jobs really should be a stepping stone to move on to higher skilled higher payinng jobs. Low wages should be an incentive to improve yourself not as means of complete economic autonomy. People can also join the military to obtain discipline and skills as well as a way to pay for college. There are innumerable ways for an individual to move up the economic latter. 50 plus y/o with skills should be okay but an unskilled 50+y/o is going to have a proplem unfortunately. Hopefully the availability of programs to help then transition back into the workforce are available.
To an extent yes, I do however run into underemployed folks all the time. Latest a 30 year old MD/MBA combo from UCLA driving UBER.
When you make an accusation like “something missing in story” what you are saying is that you think said person is lying or a liar. You must be from California or the west coast where people are so fake & two faced that what is ‘not said’ is more important than cutesy cliches & saying things like ” I am concerned about”, ” I don’t feel comfortable with”
“If we had universal healthcare, single payer, like the democrats want, you would see a significant increase in employment.”
Why would employment increase?
If healthcare were guaranteed, then that would be a major reason NOT to work.
Furthermore, all this political chatter about “making healthcare affordable” has already degraded the quality of future healthcare. If you are an intelligent young person deciding how to make a lot of money, a profession where the politicians are discussing how they will fix prices (i.e., limit income) will NOT be chosen.
It is well known that people are limiting hours and income to keep their income low enough to still qualify for medicaid. I believe those same people would work full time if this wasn’t the case.
That is horrible to hear but I am wondering if there is something missing in that story. Sometimes there is a good reason for him doing that.
When you say ‘that is horrible to hear’ what you really mean is that “than god it is that other guy & not me” and you would distance yourself from said person in a NY Minute. Next : Limiting hours to Qualify for medicaid (did you hear that from Fox news as well)??
medicaid is the lowest of the low in terms of medical coverage, most doctors do not accept medicaid in any form, forget about seeing a specialist unless you want to wait 9 -12 months.. Medicaid is THIRD Coverage, any ACA Obamacare policy entitles you to second class healthcare with slightly more options than being on medicaid.. In the USA if you want first world health care you need to be on a commercial employer based (nothing close to ACA or Medicaid). health insurance policy..
Possibly, very good chance a bit of burnout. Took some serious effort to get the education he has already. Another possibility is education is not work experience plus if one gets an employment gap they are subject to HR dept screening. However, I commonly do run into highly educated young people in crap jobs so Mark may have a point.
More Fox news nonsense.. People being paid “not to work”?? where are they getting money to buy food from?? Those same employers wouldn’t hire someone who took time off from working (for whatever reason) and has that dreaded “gap in employment”.. You know it as well as I do.. There are alot of people ‘locked out of the workforce’ because of a criminal record, gap in employment, physical problem like missing teeth, missing limbs or other perceived disability, age discrimination is a big problem as well, most of the job losses from the 2008 recession were concentrated in those age & older, then when the economy recovered these same companies hired mostly fresh faced (white & asian) “recent” (under 27) college grads. Again not politically correct for Fox or Marketwatch.com to report on but is 100% true.
Are you serious. Do you need a safe space?? There are two sides to every story in case you don’t know and I think someone with those credentials has more to the story than he is telling. Your assumptions about what I am thinking are out of line. As far as not working to keep medicaid? I am getting this from business owners and supervisors of companies not Fox news. Again go suck you thumb and crawl up in the fetal position if that makes you feel better. Get a grip.
My son graduated with a math degree year 2 yrs ago and found a job with no problem. All of his classmates the same. The job he took that wasn’t his first choice but he was promoted after a year but just quit to go to NYC and work for an investment bank (ugh). He was not an A student but he had determination and work ethic. Also I have not met an engineering graduate looking for a job. In MI we had a lot of engineers unemployed after the economic crisis and none of them looked for work very long.