
The yield curve is said to steepen when the spreads between short-term and long-term rates increases. The yield curve flattens when spreads shrink.
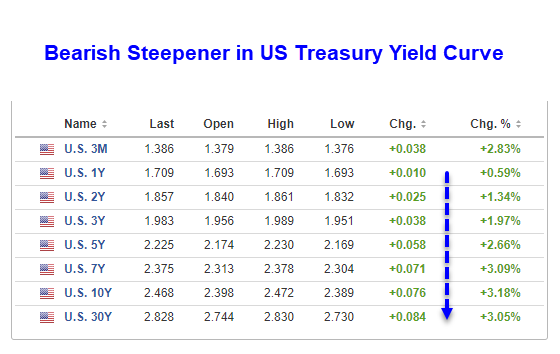
- A bearish steepener occurs when rates are rising and long-term yields are rising more than short-term rates. Spreads widen.
- A bullish steepener occurs when rates are falling and short-term rates are falling faster than long-term rates. Spreads widen.
- A bullish flattener occurs when rates are falling and long-term rates are falling faster than short-term rates. Spreads narrow.
- A bearish flattener occurs when rates are rising and short-term rates are rising faster than long-term rates. Spreads narrow.
The terms bearish and bullish refer to capital gains (bullish) or losses (bearish) if one is invested in government bonds.
Bearish Steepener Meaning
A bearish steepener is generally a sign that market participants believe the economy is getting stronger and the Fed (Central Bank), will be hiking rates faster than previously anticipated or more than anticipated.
What Happened Today?
- The housing market was stronger than expected: Housing Starts Jump More Than Expected: Economy Overheating?
- The current account deficit shrank more than expected: Current Account Deficit Shrinks Due to Hurricanes
June Rate Hike Odds

Synopsis
- The Fed Funds rate is currently 1.25% to 1.50%
- The odds of two quarter point hikes through the June meeting increased from 32.5% yesterday to 38.1% today. This is consistent with the bearish steepening of the yield curve.
I did not believe the Fed would hike as much as expected in 2018, and today does not change my mind.
Mike “Mish” Shedlock


First of all LIBOR is on a tear, which gives the Fed rate policy some tailwind. Although Euro junk is still yielding less than UST. LIBOR is a daily fix, so it might change at any time, and for those who say its rigged, I can only laugh. High Yield Bonds are looking toppy, and that means that a rate collapse is still possible. The curve is only narrowing in certain places and so far the change in long yields is only white noise.
https://s3-us-west-2.amazonaws.com/maven-user-photos/mishtalk/economics/0ecovKym8U6vMOltcykylA/oO3b-C18WUuF8yYNy3pnjw
Exponents folks. These debts work on an exponential scale. Add in some more devastating storms, possible other black swans. Really, the Republicans set themselves up to lose for a loooong time. No long term game theory here. Or maybe they at smart. Maybe they saw one last way to cash out and then they all leave before the ropes and pitchforks come out. No one who can do simple accounting can honestly say the government finances will survive this. I’d leave congress too. Winning the presidency or senate will be like being president 3 months before the meteor hits.
I think formula57 is right. It’s the new tax plan that I suspect will add way more than $1.5 trillion to the deficit over 10 years. And even if the dems take control in 2021, they likely won’t be able to change much. No one likes higher taxes and the economy may not be able to handle higher taxes.
The prospective tax changes make account for some (or most) of this steepening. The effects of funding the increased government fiscal deficit will be to increase real long-term interest rates by up to 70 basis points, so suggest macroeconomists Stoeckel and McKibbin from ANU’s Crawford School of Public Policy who have modeled the the expected effects. They suggest the tax plans whilst producing short-term gains will leave Americans worse off by 2030.
Mish, writing u email, on your blog, is difficult.
It will be a channel. The 10Y is a resistance line, the 3M is support. Everything in between is the body of the chart. This body is moving up to the resistance line. That,s what you see on your data. If you delete all data on the X &Y axis, including the zero line ==> since 2008 this body is tilting moderately up, but since Sept 2015, the trend is steeper. I think that when the chart will reach the top, it will not be able to breach the resistance line. The 3M will trend down, – osc around the invisible zero – and move further down, in order, in a sling shot to move higher again and breach the resistance line. Currently, the distance between the top and the invisible zero is not large enough for a sling shot action. I think I just shocked your prof. If you take 10Y US & Japan, from 1995 until now, it look like the 3M &10Y from 2008. Japan in trading range much longer than any other country. $JPT10Y, one day, will rise the most !!
Mish, take a chart of 10Y & 3M and nothing in between.