
If it feels like you are not getting ahead, it’s because you aren’t. Six charts. 
Inflation has accelerated to the upside in March and April. Wages have not kept up with inflation.
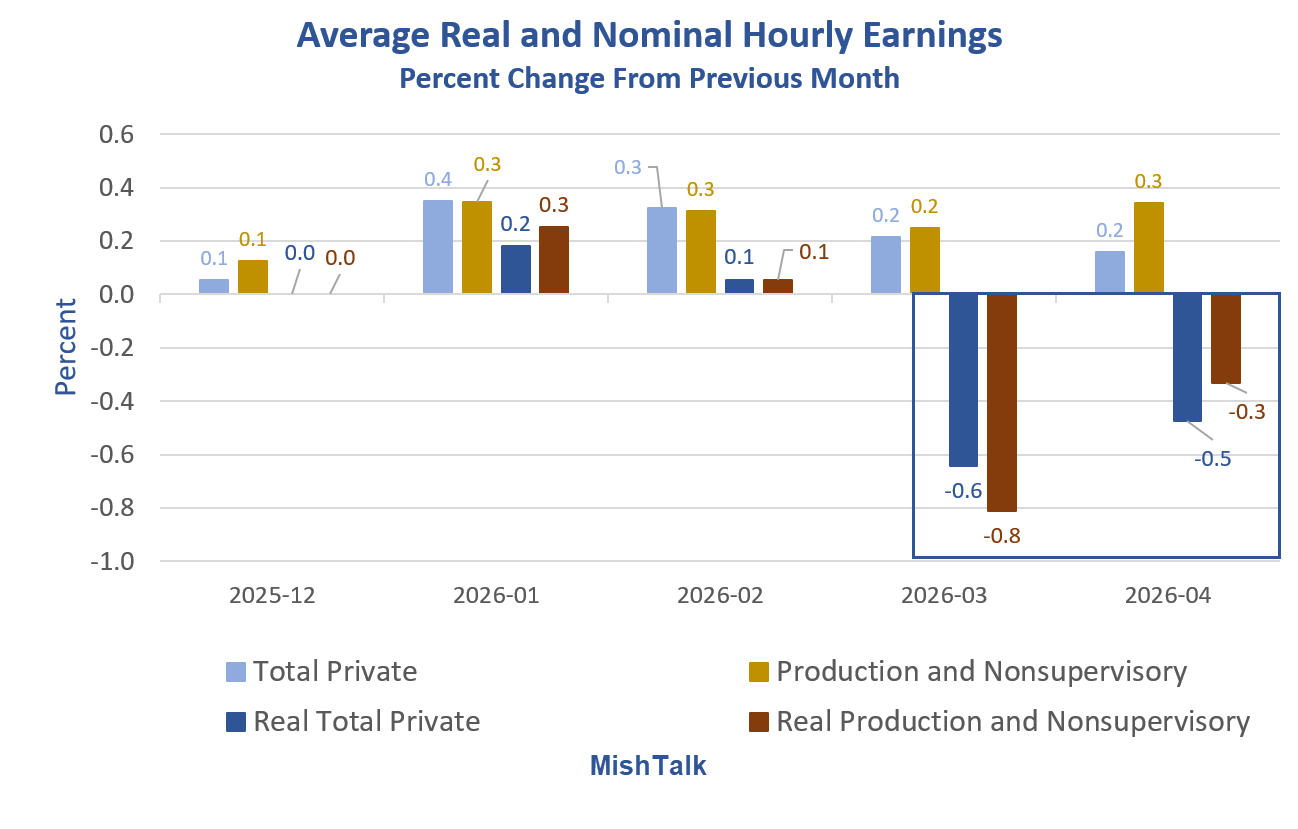
The BLS Real Earnings Report shows real (inflation adjusted) wages have declined again.
All employees: Real average hourly earnings for all employees decreased 0.5 percent from March to April, seasonally adjusted. This result stems from an increase of 0.2 percent in average hourly earnings combined with an increase of 0.6 percent in the Consumer Price Index for All Urban Consumers (CPI-U).
From April 2025 to April 2026, real average hourly earnings decreased 0.3 percent, seasonally adjusted.
Production and nonsupervisory employees: Real average hourly earnings for production and nonsupervisory employees decreased 0.3 percent from March to April, seasonally adjusted. This result stems from a 0.3-percent increase in average hourly earnings combined with an increase of 0.7 percent in the Consumer Price Index for Urban Wage Earners and Clerical Workers (CPI-W).
I calculate the numbers myself and sometime vary by 0.1 percentage points due to rounding.
Real vs Nominal Hourly Earnings Detail

Real vs Nominal Hourly Earnings Year-Over-Year
- Private: 3.43 Percent
- Real Private: -0.2( BLS -0.3)
- Production and Nonsupervisory: 3.67 Percent
- Real Production and Nonsupervisory: -0.2( BLS -0.2)
Real Average Hourly Earnings Dollars Per Hour Detail

I calculate total private real earnings per hour in April at $11.25, and $9.89 for production and nonsupervisory workers. Both match the BLS.
Since January of 2025, total private real earnings are up by $0.01. Production and nonsupervisory workers have gained $0.04.
Both sets assume you believe BLS inflation calculations. My title called this no growth. But if you insist on a penny or four, and accept BLS inflation calculations, OK, it’s positive.
Real Hourly Earnings Year-Over-Year Detail

Real Hourly Earnings Year-Over-Year Percent Changes
- Total Private: -0.20 percent (BLS says -0.30), Lowest since April 2023
- Production and Nonsupervisory: -0.20 percent, Lowest since February 2023
Let’s put this all into perspective with one key chart.
Nominal and Real Average Hourly Earnings Since 1964

The data series for total private does not start until March of 2006. So let’s focus on the long-term data.
In nominal terms, production and nonsupervisory wages rose from $2.50 t $31.94.
$2.50 in 1964 was worth $8.04 in real terms. In real terms wages rose from $8.04 to $10.00.
Production & Nonsupervisory Workers Annualized Growth
| Measure | 1964 Value | April 2026 Value | Annualized Growth |
|---|---|---|---|
| Nominal | $2.50 | $31.94 | +4.19% per year |
| Real (1982-84 dollars) | $8.04 | $10.00 | +0.35% per year |
These are actual BLS numbers. Happy with +0.35% per year on average?
Bear in mind, the CPI does include any increase in property taxes, homeowners insurance, or the price of the home itself in its measure of inflation.
Moreover, the BLS weights food at home vs food away from home inaccurately, and it does not factor in tip inflation.
The average person is not really getting ahead.
Trump Not at All Concerned
But hey, have you looked at the DOW?
Inflation benefits the asset holders and those with first access to money: The banks, the wealthy, the politically connected, and governments via taxation.
Everyone else loses. And that’s why so many people are miserable.
Related Posts
August 11, 2025: Is Homeowners Insurance Understated in the CPI? Shop Around!
Our Insurance went up by $2,000. Then another $2,000. Here’s our story.
If you own a home, what percent of your income is spent on your homeowners’ insurance?
Under 1/2 of 1 percent? [As the BLS says?]
August 12, 2025: Where Do You Spend Money on Food? How Screwed Up Are the BLS Weights?
Does the BLS match your budget?
May 12, 2026: CPI Hotter than Expected, Highest in Three Years, a Genuine Disaster
Inflation in April was another scorcher. Here are some month-over-month and year-over-year charts.


This nestles in nicely with the ever increasing CPI.
April PPI triple expectations!
1.4% vs 0.5% est.
https://www.bls.gov/news.release/ppi.nr0.htm
2 year treasury above 4% now! bwahahahahaha.
Oh the humanity!
“It’s Trump turtles all the way down and inflation all the way up!”
Wage levels are purely a function of bargaining power. Employers have a natural advantage: in any given market there will be far fewer companies who need a skill than people selling that skill. That makes it much easier for employers to collude to keep the bidding price for a skill low than for labor to collude to raise it. On the product prices side, market monopolization also allows companies to collude to keep prices higher than they would be in a competitive market. What’s been happening over the last 40 years shouldn’t come as a surprise to anyone.
There is a recent trend in the federal debt that does not seem to add up, that being the total debt has held around $39 trillion for the last 2.5 to 3 months per debt to the penny website. One might let that go during the early time frame but lately the increased tax receipts are finished, the war adds to expenses, and tariffs have been put in their proper place. Is the treasury failing to fund retirement accounts or some other gimmick to hold debt steady?
America is last; America First was orange code for America Last.
Trump: Not even a little bit. I don’t think about Americans’ financial situation
Trump is in between a rock and a hard place / quagmire.
There is no good choice.
He doesn’t know what to do.
Credit Card interest rates aren’t lending much of a helping hand either.
I pay mine off monthly. Just happened to notice it would be 18% if I didn’t.
Typically even worse per AI:
Credit card interest rates in the U.S. have fluctuated significantly over the past 50 years, moving from roughly 17% in the 1970s to historic highs near 23–24% by early 2026. Rates generally hovered between 12% and 18% for most of the 1990s through the 2010s before sharply rising.
Trump told reporters his”policies are working incredibly.” What else do we need to know?
The only true word out of his mouth is ‘incredible’ …. literally ‘lacking credibility’.
If you make your money from doing work that benefits anyone but the wealthy, You Don’t Matter.
Working to produce wealth makes you a taker. Having wealth makes you a maker.
Does anyone even believe all the BS statistics the government puts out?
‘They’ve’ been saying wages have kept up with inflation since 2020. Lies. May be true for the top 40%, but not the bottom 60%. You wouldn’t have such widespread discontent if wages actually kept up with inflation.
Federal workers got a 1% raise this year from Trump and NO locality pay increase. MAGA cheers, but wait until they need help from a federal worker and find that they can’t get help because all the good dedicated workers left Federal service and all you have are underpaid contractors. You get what you pay for. You reap what you sow.
What would we need help from a Federal worker for? Government doesn’t actually do anything useful. Their workers are lazier than anyone working in the private sector could possibly imagine.
Those ‘lazy government workers’ would beg to disagree with you. A lot of them were dedicated lifetime reliable workers. I say ‘were’ because many of them resigned if they weren’t fired.
In their place you will have low paid no-benefits contract workers who are inexperienced and incompetent. High turnover as well. As I said, you get what you pay for.
I thought this MoFo had declared victory over Iran a doze times already.
Nytimes reporting that US intelligence indicates that Iran retains 30 out of 33 functional missile sites along the strait of hormuz. All that expensive armament we dropped on them didn’t quite make a 10% dent in their capability.
Whenever the MSM reports on what U.S. intelligence ‘says’ then it should be taken with a grain of salt. I’ll only believe it if I go over to Iran and verify the 30 sites myself. Otherwise, no.
Ask yourself: Why is the NY Times reporting this ‘story’? My guess is they’re trying to justify the ‘need’ to keep the war going.
Since we’re also reported as being low on offensive and defensive munitions, I’m not sure that justification holds up.
Oxymoron
Trump has seen our future, and it is perfect in every way
If only people had listened to this guy…
https://www.youtube.com/watch?v=rRndMiVIB-w
Do worry, Trump will find a way to make things even worse.™
And this is one of the better stats since the reign to taco began.