

Private domestic sales suggest economic overheating.
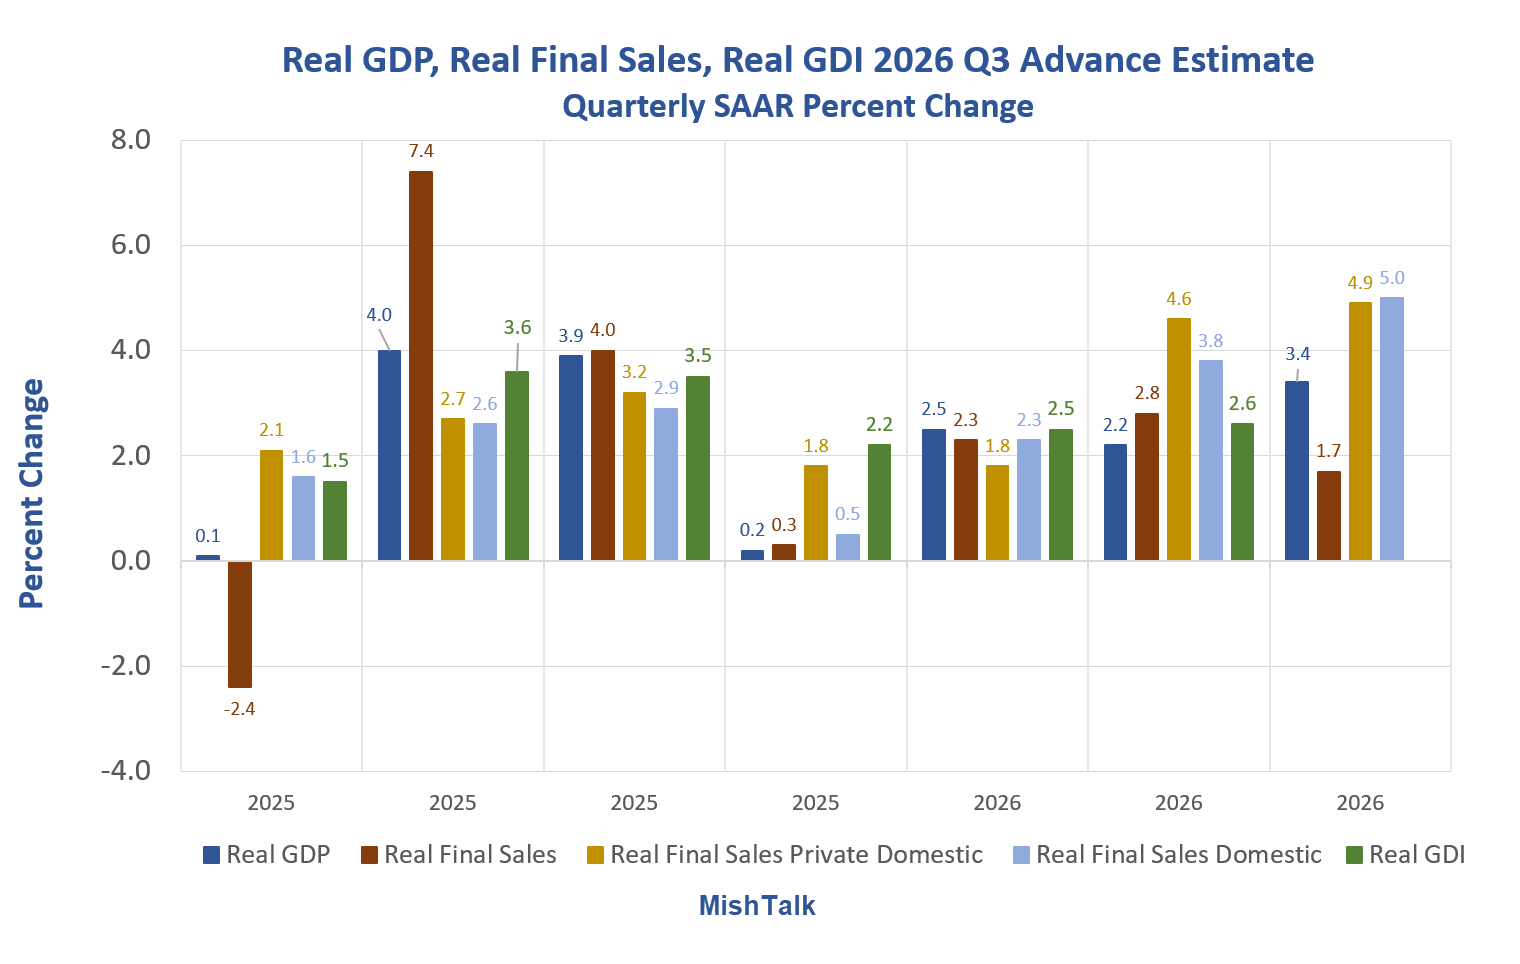
The BEA reports Real Gross Domestic Product (GDP) increased at an annual rate of 3.4 percent in the third quarter of 2026 (July, August, and September). In the second quarter, real GDP increased 2.2 percent.
Real Third-Quarter GDP and GDI
- Real GDP 3.4%
- Real Final Sales: 1.7%
- Real Final Private Domestic Sales: 4.9%
- Real Final Domestic Sales: 5.0%
- Real GDI: N/A
Real Gross Domestic Income (GDI) is not available in the advance (first) release of the quarter.
Contributions to GDP

Percentage Point Contributions to GDP
- PCE Services: 1.89 PP
- PCE Goods: 0.63 PP
- Government: 0.90 PP
- Residential Investment: -0.12 PP
- Nonresidential Investment: 1.78 PP
- CIPI: 1.61 PP
- Exports: -0.68 PP
- Imports -2.64 PP
Change in Private Inventories and Real Final Sales
The difference between real GDP and Real Final Sales is Change In Private Inventories (CIPI) that nets to zero over time.
Thus, an essentially meaningless number added 1.61 percentage points to GDP.
Real final sales is the true bottom line estimate of the economy. It’s only 1.7 percent.
Yet, Real Private Final Domestic Sales, a number the Fed watches, are a whopping 4.9 percent.
Government Spending
Government spending (election-timed?) added 0.9 percentage points to GDP.
Hooray?
Imports and Exports
Imports don’t subtract to GDP. The have no impact of GDP at all. The D in GDP explains why.
The BEA subtracts imports because its initial assumption is that all sales are domestic.
Otherwise the BEA would be trying to figure out things like “What percentage of this hammer from Home Depot is domestic?”
Net exports are -2.64 (imports) plus -0.68 (exports) which totals -3.32 percent.
Tariffs, as expected in this corner, did nothing to fix trade imbalances. Indeed, the latest trade reports show the deficit is the widest in history ignoring the wild swings around the start of Trump’s reciprocal tariffs.
Real GDP, Real Personal Income, Real GDI

We do not have GDI or corporate profits in the advance release. But we do have real personal income.
And real personal income is only up a total of 0.79 percent since 2025 Q2.
How is that distributed? I think you know the answer. And it’s why a majority of people do not buy Trump’s preposterous claim of “greatest economy ever.”
I will discuss income in more detail in a second post.
Reflections on the Economy
Based on private domestic sales, the economy is overheating.
The surge in imports is related to AI which is also overheating. I will also do a breakdown of the AI impact on GDP shortly.
Subtract CIPI and government spending from the report and real final sales was only 0.8 percent.
Four things are obvious: The Fed is behind the curve, people are suffering from inflation, the AI boom is unsustainable, and this report is nowhere close to what the headline number looks like at first glance.
Related Posts
October 28, 2026: The September Advance Trade Balance in Goods Is Negative 134.9 Billion
Biggest Trade Deficit In History
Excluding the enormous trade distortions caused by Trump’s tariffs, we have the largest trade deficit in history.
Click for more details and charts.
October 28, 2026: The Fed Holds Interest Rates Steady with Two Dissents for a Hike
As expected, the Fed held rates steady. But a dissent by Lisa Cook is sure to anger Trump.
The Fed wants more data. Today it got more data. And a deeper dive into that topline 3.4 percent GDP suggests some real issues.


Share of Labour Compensation in GDP at Current National Prices for United States
https://fred.stlouisfed.org/series/LABSHPUSA156NRUG
These charts are going the wrong way.
Sliding into the abyss as the Fed sits on its hands. Too much speculation, which is supposed to be the Fed’s job to stop with a myriad of regulatory levers that have been left in the back of the closet at the Fed for several decades, now. Mind you, this isn’t economic growth we are seeing, it is rampant speculation, and the Fed is shirking its duty to slow it down.
Both short-term and long-term money flows peaked in the 3rd quarter of 2026. It’s no happenstance that inflation and real output are reading above average.
The 4th quarter doesn’t look so great, esp. for the real output of goods and services.
How much of this is a direct result of the AI build out. The numbers that the tech compnaies are reporting suggest a lot of money is being spent. My sense is that i you are in one of the industries or areas where the building is happening, life is good, but if you are not, the GDP is not flowing to you.
I asked AI that question a few minutes ago, and it came up with a 1.1% growth with AI removed from the calculation.
This is an odd comment, and one familiar with many of the commenters here.
“AI build out” is where spending may start. But any landowner, electrician, chip supplier, etc. that gets funding from an AI build then goes out and spends that money/income again elsewhere in the regular economy and the rest of us benefit. Same for increased vacation spending by regular people, spending by local governments on teachers, etc.
Why do you care so much where the spending begins, as long as someone voluntarily decides to spend that money to begin with?
The point could be that a lot of the AI spend is debt.
Debt that has to be repaid, at which point the effect on growth is reversed.
If AI iTunes out to be a malinvestment, the rest of the economy suffers.
See, for instance, the initial internet boom in 1999, or the over investment in housing in 2007.
Yes, alot of AI build out is funded by debt, as is almost all Investment, including commercial real estate and home building. That’s why it’s the most volatile component of GDP.
But when it’s being built, people get sales, jobs and income.
And consumption (not Investment) is over 2/3 of the GDP and it grew at a real (inflation-adjusted) rate of 3.8% in Q3.
or the 1873 RR bubble and panic and worst depression the usa has experienced.
The bigger problem will likely be the pulling forward of demand. At some point soon, it is going to be crickets for transaction volume, just like China is currently seeing. Expect a huge pullback in private and business consumption on the near horizon.
Mish, I’m not following your addition and subtraction to get to real final sales of only 0.8% you mention at the end of the post.
The reason why the Fed follows Real final domestic private sales (at a huge 4.9% increase) is that metric already strips out government spending, trade and inventory swings. So it isolates underlying private-sector demand which was obviously strong for consumers and businesses (yes, including AI development)
It must suck to be rich.
Now it does.
They are spending it like crazy while it still spends at all.
My question is hopefully simple enough Mish: what are the options for cooling down the economy? Are any potential outcomes not a huge disaster? It seems to me everything points to a nightmare in the makings, especially if you have a retirement account slotted into the teetering market.
Google had its worst day on record today. Why? Their own unprofitable AI garbage devastated their ad business. Not a good sign in my book.
Well, this doesn’t fit the narrative, now does it? How many of you here will continue to believe (hope) that the “Trump economy” is a disastrous Depression with people who can’t afford anything, including our boy Creamer? The poor guy is probably scoping out cardboard boxes right now, looking to get a good spot in Skid Row. He can’t find a job, has no wealth and is hungrily looking at the rats in the dumpster bins (In between posts here).
I’m confused. Isn’t this economy absolutely terrible, and “the 99%” are just getting killed? How could that be?
Or is it all just a partisan exercise in PR for the Democrats?
One wonders!
Inflation came in at 3.7%. Wonder no more, m’lady.
Business Man is clueless about inflation and why people are angry.
I’m very aware of it. My point is that the Left is playing it up like 3+% inflation is an existential crisis of survival. It’s not. It is uncomfortable, but the effect of it is being exaggerated for partisan reasons.
For example, the price of gas today is less than the peak of Biden era.
Most of the price increases in products came from prior years, not this year. Yes, it’s cumulative, but wages have also gone up dramatically. I am paying my people more than 100% more than pre-Covid, and they seem fine. Because labor is much more scarce they are doing better economically. They are pissed because they thought they were getting ahead even more, but now see that other prices have caught up too. The reality is that everyone’s wages will always be relative.
Also, everyone complains when their party is not in power. That’s just human nature.
All I’m saying is that you guys are not going to get me to believe all of these apocalyptic visions. It’s listening to a bunch of old ladies yapping about nothing.
And as for you, I’m quite surprised that you would dismiss the opinion of a reader as “clueless” simply because I disagree with you. I used to respect your opinion, whether I disagreed or not. I think it’s time to disengage from this site and put my time elsewhere, because your posts have become too partisan and to biased. I have an economics degree, too, and I can see where you are headed, and it’s not informative.
It’s been a good run, but time to move on. Good luck (sincerely) to all of you.
Off to your safe space then. Say hi to the other snowflakes for me.
These costs seem high. I think it also depends on where you live. New England relies on oil for heating. i spent $1000 for 160 gallons. I have never paid these prices – not under Biden. When I spoke to local owner he said cost were as high as he had ever seen. And the average homeowner might get 4 tank fills a season. Also where I live a car is mandatory and people are really rationing how much they drive. The cost of fuel is impacting cost of food, contruction, etc. The real problem is that these rates have been high for a while with no sign of relief. Because of that vendors are now adding a fuel surcharge to bills. These price increases did not come from prior years. This is a direct impact of the war Trump started.
I, for one, am sorry to see you go. I don’t want this site to become an echo chamber. I like hearing (and arguing with) opposing views, it helps me make sure I haven’t missed something obvious. But there is a lot of cooking here, and it generates a lot of heat. Some can’t stand that.
Imagine getting an economics degree and not understanding how inflation works for people. A Yale grad I’m sure.
You came in here with a sniveling attempt at a personal swipe at me, got called out as an idiot, and now you’re packing up so I don’t remind you of this blunder when time proves Mish right. Bye bye snowflake! Hope the kids like your books!
Businesswoman doesn’t need such numbers, those are for the kids to read about in those books she’s handing out for Halloween.
I used to love me some Chick tracts… almost as good as Creepshow comics, and free! I was quite the little god botherer for a while, even had mental conversations with a voice that sounded like Orson from Mork and Mindy.
It was a confusing time.
Real GDP and Real final private domestic sales are inflation-adjusted, and they were historically well above average this quarter
Why would I need a cardboard box when I’m clearly living in your head rent free? A lot of kids from Epstein Island in here too, weirdly enough, but I digress.
This is what? The third or fourth time you’ve tried this approach? Now you’ve got Mish calling you an idiot too, so keep it up!
Trump’s 2nd term average quarterly real GDP is 2.3%. In the past he has characterized numbers under 3% as being disastrous.
BM, the pushback isn’t that the economy is OK, it’s that Trump says these kind of things:
“It’s a new Golden Age.”
“We have the hottest economy anywhere.”
“Tariffs will repay the deficit.”
“We are going to eliminate the income tax because we are taking in so much in tariffs.”
“We will pay out $5000 in checks to everyone if the Republicans win.”
“We have $10 trillion in investment from overseas.”
Grok, can you compare the real personal income change for the average American during the last two years of the Biden administration compared to the first two years of the second Trump administration?
Annual averages (for context)
• 2023: $51,226
• 2024: $52,418 (+2.3% from 2023)
• 2025: $52,986 (+1.1% from 2024) 
Summary comparison
• Over the roughly comparable late-Biden window (2023 into early 2025), real DPI per capita rose about 4.5% (or ~6.5% on a calendar 2023–2024 basis). Growth was solid after the earlier post-stimulus and high-inflation period, with wages and employment gains outpacing price increases in 2023–2024.
• In the first ~21 months of the second Trump administration (through September 2026), the increase has been smaller—about 1.7% total. Growth has been positive but modest/slower on an annualized basis (roughly 1% per year so far). Levels remain higher than at the end of the Biden period, but the pace of real gains has decelerated.
Even grok the child porn producing robot has more braincells lmao
Maybe if they used a real inflation figure to get to the “real” GDP I might give the report some credence.
Right on. At least 6 people get it.
Understated inflation figures push the “real” GDP up (overstated).
That explain the over all malaise since GFC as fiat money has flooded the world.
It’s not R or D, it’s “them”.
I can make any wino look prosperous, a financial wizard, even, as long as that wino can continue to borrow and refinance.
Do we even still have winos? Seems like they all moved on to megadrugs.
oh hell yes there are winos. live in a funky hood for a bit and see the local liquor store junkies waiting for their daily drug of choice. or go to some high end yacht club or country club at lunch time during the week and see some of the bored spouses and offspring chugging down vino everyday. charleston SC women were fairly open about it. kind of a throw back to the mad men days.
Net private saving: Households and institutions is on a downtrend. So is the Personal Saving Rate
2026-01-01 5.6
2026-02-01 5.3
2026-03-01 5.1
2026-04-01 4.4
2026-05-01 4.4
2026-06-01 4.4
2026-07-01 4.5
2026-08-01 4.0
2026-09-01 3.8
Consumers are showing stress signs.
Wow, great post. Too bad “Business Man” left.
An extremely interesting bar chart would be month over month percentage increase in income (green bar) and consumption expenditures (red bar) side-by-side for each of the last six months, or longer. It’s a slide into the abyss, and the FOMC is sitting on its hands.
Warsh need a prescription to keep the Fed’s inflation target hard. It’s a lot softer than he claimed yesterday.