
Initial Reaction
Today’s establishment survey shows jobs rose by 148,000. The household survey (Table A) shows employment only rose by 104,000 while unemployment fell by 40,000.
ADP estimated December Jobs at a whopping 250,000.
Mark Zandi, chief economist of Moody’s Analytics, offered this amusing comment as noted by ADP: “The job market ended the year strongly. Robust Christmas sales prompted retailers and delivery services to add to their payrolls. The tight labor market will get even tighter, raising the specter that it will overheat.”
Let’s dive into the details in the BLS Employment Situation Summary, unofficially called the Jobs Report.
BLS Jobs Statistics at a Glance
- Nonfarm Payroll: +148,000 – Establishment Survey
- Employment: +104,000 – Household Survey
- Unemployment: -40,000 – Household Survey
- Involuntary Part-Time Work: +102,000 – Household Survey
- Voluntary Part-Time Work: +100,000 – Household Survey
- Baseline Unemployment Rate: flat at 4.1% – Household Survey
- U-6 unemployment: +0.1 to 8.1% – Household Survey
- Civilian Noninstitutional Population: +160,000
- Civilian Labor Force: +64,000 – Household Survey
- Not in Labor Force: +96,000 – Household Survey
- Participation Rate: flat at 62.7 – Household Survey
Employment Report Statement
Total nonfarm payroll employment increased by 148,000 in December, and the unemployment rate was unchanged at 4.1 percent. Employment gains occurred in health care, construction, and manufacturing.
Unemployment Rate – Seasonally Adjusted

The above Unemployment Rate Chart is from the BLS. Click on the link for an interactive chart.
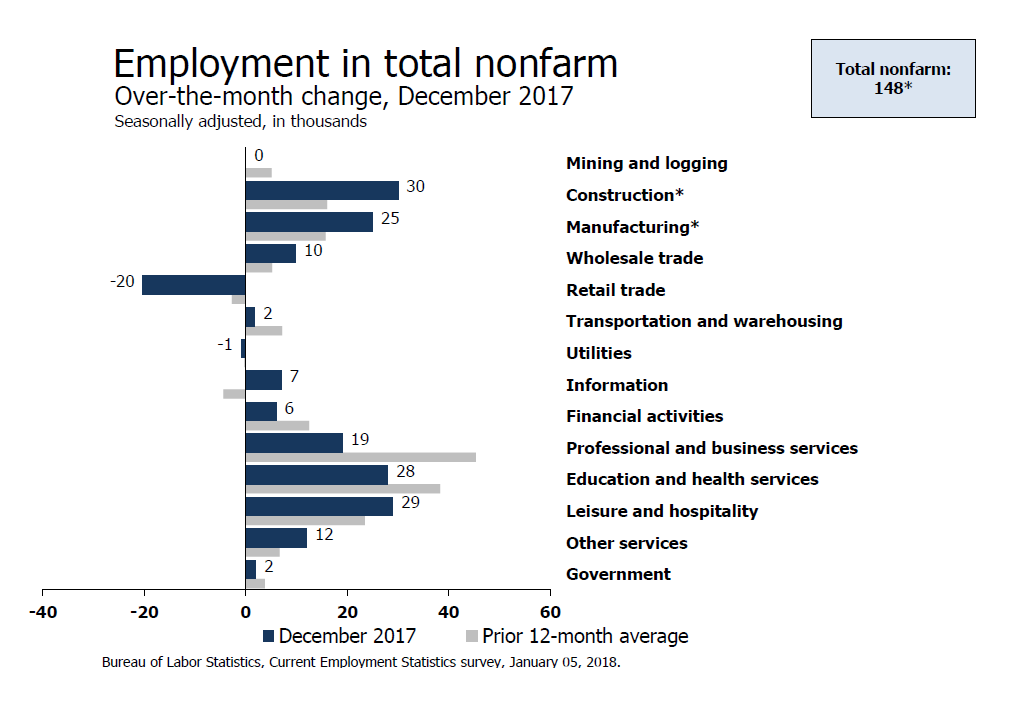
Nonfarm Job Change from Previous Month

The above chart and the following chart from the BLS show establishment survey jobs, not household survey employment.
Nonfarm Jobs Change from Previous Month by Job Type

Hours and Wages
The Average Weekly Hours of all private employees was flat at 34.5 hours. The average weekly hours of all private service-providing employees rose by 0.1 hour to 33.4 hours. Average weekly hours of manufacturers was declined by 0.1 hour to 40.8 hours.
The Average Hourly Earnings of private workers rose $0.07 to $22.30. Average hourly earnings of private service-providing employees rose $0.07 to to $22.06. Average hourly earnings of manufacturers was flat at $21.14.
Birth Death Model
Starting January 2014, I dropped the Birth/Death Model charts from this report. For those who follow the numbers, I retain this caution: Do not subtract the reported Birth-Death number from the reported headline number. That approach is statistically invalid. Should anything interesting arise in the Birth/Death numbers, I will comment further.
Table 15 BLS Alternate Measures of Unemployment

Table A-15 is where one can find a better approximation of what the unemployment rate really is.
Notice I said “better” approximation not to be confused with “good” approximation.
The official unemployment rate is 4.1%. However, if you start counting all the people who want a job but gave up, all the people with part-time jobs that want a full-time job, all the people who dropped off the unemployment rolls because their unemployment benefits ran out, etc., you get a closer picture of what the unemployment rate is. That number is in the last row labeled U-6.
U-6 is much higher at 8.1%. Both numbers would be way higher still, were it not for millions dropping out of the labor force over the past few years.
Some of those dropping out of the labor force retired because they wanted to retire. The rest is disability fraud, forced retirement, discouraged workers, and kids moving back home because they cannot find a job.
Strength is Relative
It’s important to put the jobs numbers into proper perspective.
- In the household survey, if you work as little as 1 hour a week, even selling trinkets on eBay, you are considered employed.
- In the household survey, if you work three part-time jobs, 12 hours each, the BLS considers you a full-time employee.
- In the payroll survey, three part-time jobs count as three jobs. The BLS attempts to factor this in, but they do not weed out duplicate Social Security numbers. The potential for double-counting jobs in the payroll survey is large.
Household Survey vs. Payroll Survey
The payroll survey (sometimes called the establishment survey) is the headline jobs number, generally released the first Friday of every month. It is based on employer reporting.
The household survey is a phone survey conducted by the BLS. It measures unemployment and many other factors.
If you work one hour, you are employed. If you don’t have a job and fail to look for one, you are not considered unemployed, rather, you drop out of the labor force.
Looking for jobs on Monster does not count as “looking for a job”. You need an actual interview or send out a resume.
These distortions artificially lower the unemployment rate, artificially boost full-time employment, and artificially increase the payroll jobs report every month.
Final Thoughts
There is a clear weakening pattern in establishment survey jobs from year to year. Hurricanes distorted the last four months of data, twice in each direction.
Last month I commented “The final hurricane impact is still unknown at this point.”
This month it is clear the hurricane impact is over.
Weak wage growth has not kept up with inflation, despite the BLS purporting otherwise.
Mike “Mish” Shedlock


nic9075, sounds like nonsense. Qualified workers can’t find jobs in IT, finance or accounting, and six figure job posts in those locales are rare, especially in IT. The UE rate for skilled workers is extremely high, and lots of postings are completely and utterly fake.
Whenever I hear from someone that an employer receives 300 resumes for a job post, it is the same as when as when a recruiter says that a position has ‘been put on hold’.. Both excuses are pure BULLS&&&T
Employers are hardly overwhelmed with any Resumes let alone for qualified workers. Even six figure job posts in NYC and Boston in Accounting, Finance and IT get virtually no applicants or candidates since the UE rate for skilled workers is basically zero
“lack of skilled workers”? WTF are you talking about? Employers are so overwhelmed with the resumes/applications of skilled workers that they have the luxury of throwing most of them in the garbage. Wages are not rising meaningfully which is what you’d see if there were *any* shortages.
My concern is that the amount of data and the level of accuracy portrayed in how it is presented hides how low quality the data is.
https://www.themaven.net/tfmarketadvisors/macro-reports/friday-s-job-report-was-more-about-bad-data-than-bad-jobs-bAU4u1FKcUKw3sTsAxkGqQ?full=1
The last time (and the time before) U3 got this low, a recession was right around the corner.
GO TRUMP! Or maybe not. This continues the downtrend in job creation from 3M in 2014, 2.7M in 2015, 2.2M in 2016, and now just 2M in 2017.
The tax cuts are going to bring in record revenue. Trump can very well get reelected in a landslide similar to Reagan when congress was controlled by democrats back then
Consumption is growing across the board at a record rate. The 5% just happened to use for stuff like art work and real estate. The bottom 50% spends on Xbox games, tattoos, gym membership and of course designer clothing
Nic0975, the national debt never went down during the 80s. It never even dropped in during the 4 years of ‘budget surpluses’ in the 1990s.
If the loop between rising share markets and the top 5% growing consumption is not broken then employment will be stable. When it is broken employment will plummet.
Next wage growth is going to break out likely above 4% this year. There is a clear upward trend. Remember this report was taken BEFORE the tax cut
First this report was taken BEFORE the tax cut was announced. In 1983 and 1984 we had 6% GDP growth with 4+ million jobs each of those years. Same will happen now.. Everyone is going to be surprised how fast the national debt drops and we return to record surplus due to higher taxes from the cuts in corporate rates
For 8 years, bad news was good news for the markets. Last year, good news was good news for the markets. So far in 2018, it turns out that mediocre news is also good for the markets.
Not a bad report and consistent with the slow climb out of the Great Recession which started 10 years ago. The pay increase annualizes to 3.7% which is decent. Too bad rent and healthcare are going up faster. Of course there’s no alternative. And best of all, with a white guy back at President, the moaning and groaning about the economy has pretty much stopped.
with virtually everything not dependent on a gov’t handout,gov’t borrowing,gov’t subsidy,gov’t contract,gov’t financing,gov’t support shutting down goin outta business is forcing bureau of propaganda statistics to always massively “seasonally adjust ” to the upside EVERY SINGL MONTH lol
I am surprised that the BLS did not do their hedonics adjustments to make this come out better. Of course maybe they did and it would have been even worse!