
Housing Starts Dive Led by Multi-Family, Revisions Negative
Housing starts are down 4% in July with multi-family down 17.2% and single-family up 1.3%. Permits are up 8.4%.
Let’s step back and make sense of it all.
Expect Revisions
My first thought at looking at the Census Bureau’s New Residential Construction Report for July is a frequent one:. Expect revisions.
Here are the key numbers, soon to be revised, and perhaps hugely so.
Building Permits
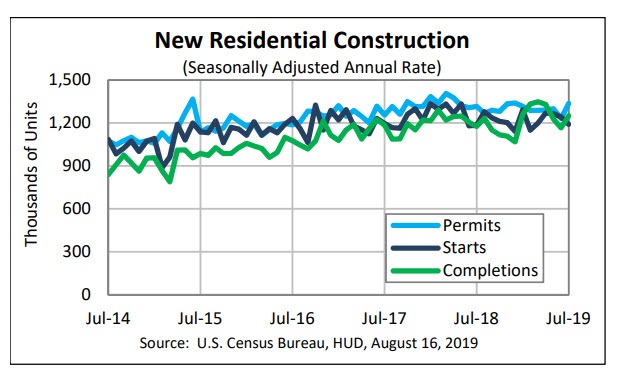
Privately‐owned housing units authorized by building permits in July were at a seasonally adjusted annual rate of 1,336,000. This is 8.4 percent above the revised June rate of 1,232,000 and is 1.5 percent above the July 2018 rate of 1,316,000. Single‐family authorizations in July were at a rate of 838,000; this is 1.8 percent above the revised June figure of 823,000. Authorizations of units in buildings with five units or more were at a rate of 453,000 in July.
Housing Starts
Privately‐owned housing starts in July were at a seasonally adjusted annual rate of 1,191,000. This is 4.0 percent below the revised June estimate of 1,241,000, but is 0.6 percent above the July 2018 rate of 1,184,000. Single‐family housing starts in July were at a rate of 876,000; this is 1.3 percent above the revised June figure of 865,000. The July rate for units in buildings with five units or more was 303,000.
Housing Completions
Privately‐owned housing completions in July were at a seasonally adjusted annual rate of 1,250,000. This is 7.2 percent above the revised June estimate of 1,166,000 and is 6.3 percent above the July 2018 rate of 1,176,000. Single‐family housing completions in July were at a rate of 918,000; this is 4.3 percent above the revised June rate of 880,000. The July rate for units in buildings with five units or more was 321,000.
Housing Starts Seasonally Adjusted

Deceptive Year-Over-Year Totals
The year-over-year single-family numbers look OK but July of 2018 offered a relatively easy comparison.
August and September will provide much harder comparisons.
Then November and December will provide extremely easy comparisons following by January of 2019 with an extremely difficult year-over-year comparison.
Confidence Ranges
- Single-family housing starts are -4.0% with a confidence range of +- 8.0%.
- Multi-family housing starts are -17.2% with a confidence range of +- 26.2%
- Year-over-year multi-family housing starts are -4.7% with a confidence range of +- 29.1%
That’s a close as it gets and that’s why we have huge revisions. Year-over-year comparisons make little sense with this kind of setup.
Big Picture

Housing Peaked May 2018

Trend Breaks
Paying too much attention to results month-over-month or even year-over-year is a mistake.
The Census Bureau chart at the top provides little information. Only by stepping back can one spot the trend breaks.
Long, Weak Trend
This was a long housing cycle trend, but also a very weak one.
- Housing Starts Feb 1959: 1,667
- Housing Starts Jul 2019: 1,191
Housing starts in July of 2019 are 41% below the level in February of 1959.
Trends Don’t Predict
The trend does not say it will continue or not.
But the economy is clearly slowing and houses are not affordable.
Lower interest rates do not make houses affordable. Over-paying is still over-paying.
Fundamental Factors
- Demographics are hugely unfavorable for much home building. Boomers are retiring and want to downsize.
- Millennials taking care of their aging parents and will eventually inherit those homes.
- Homes are not affordable. Wages have not kept up with home prices.
- Student loan debt
- Global economy is slowing
- Attitudes towards home ownership have changed.
- Interest rates are lower – The single positive
Real estate agents will always tell you “There’s no better time to buy”, but the fundamentals suggest this is a poor time to buy.
Mike “Mish” Shedlock


The STUDENT LOANS are the elephant in the room. it wiil affect HOUSING more than shockingly for years or decades to come!
Too many McMansions.
Too much municipal corruption funded by property taxes on McMansions.
The system is sick. Big government always results in big corruption. Always has, always will
It is true that lower int rates increase purchasing power. However, they also prop up sales prices.
On one hand you have a lower mortgage payment, but on the other hand, you have higher prop taxes. Has anyone done the calculation on this?
My spidey sense tells me it’s a wash, which means lower rates don’t actually help the buyer.
Not to mention the new tax code has less incentives for home ownership vs the standard deduction.
I’m staying away from RE now, maybe I’m wrong.
A bunch of neighbors and I were chatting after church a couple weeks ago. All of us reached the same conclusion as you.
For each and every one of us, property taxes were much higher than mortgage payments. It wasn’t even remotely a close call.
Who cares if the Fed lowers interest rates they charge big banks? The banks pay 0% on deposits to the public — actually they charge us usurous fees to access our own money.
Only part of these lower rates filters into lower mortgage costs, even assuming I refinance periodically. But property taxes go up up up up up.
Its not as though government services are increasing. The money is going toward corruption and pensions that the average person doesn’t get.
Municipal corruption is rampant. That is the problem all over the USA.
Mish is focusing on the wrong measures. Housing doesn’t matter unless municipal corruption gets fixed first.
My brother tells me that selling cars is about the monthly payment. Housing should be no different. So yes, interest rates down, prices up results in a wash.
DFW housing market (largest market for new construction) has seen a nice rebound the last few months. Lower rates are finally helping builders to clear out inventory that was building up during the end of 2018 and early 2019.
Resale market is having a more difficult time rebounding because prices are simply too high. Sellers are still in denial. The mismatch between available supply and and what buyers are demanding is still a problem. Inventory in DFW is still relatively low, despite the increase during the last year.
Houston real estate posted a record month in July (and better than DFW) largely because there are a lot more homes for sale, and more affordable choices for buyers.
Should be interesting to see how the year finishes up. Low rates provided a nice stick save, but where to from here? Negative rates?
Yes of course, interest rates have nothing at all to do with affordability and the two parties involved in the sale have no clue how much the house should really sell for.
Great post on housing. Agree 100%. Deflation kills asset prices, including housing. Just watch what happens to crude oil prices. Going down. I don’t care how much crude the Permian Basin is pumping right now. Deflation hurts/kills demand for it.
see my posting below on the effects of student loans, below!
Maybe responsible municipal governments will tighten their belts and lower property taxes to help?
I’m here all night … please hit the tip jar on your way out …
Ha ha, that’s a good one, Tony!
Where is the laugh emoji button?
Hilarious!
Millennials taking care of their aging parents will find that those homes were reverse mortgaged. FIFY.
Nothing a few well placed hurricanes can’t fix.