
Initial Reaction
Jobs came in much better than expected. ADP forecast a mere 67,000 jobs.
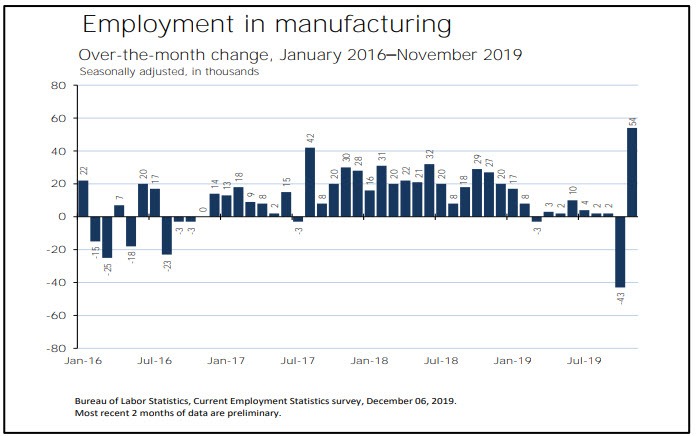
The GM strike ended and that explains a huge surge in manufacturing and auto parts jobs.
Seasonal factors also skewed the report. Thanksgiving was very late in the month, in fact, on the last possible day, November 28.
Auto Parts Jobs

Job Revisions
The change in total nonfarm payroll employment for September was revised up by 13,000 from +180,000 to +193,000, and the change for October was revised up by 28,000 from +128,000 to +156,000. With these revisions, employment gains in September and October combined were 41,000 more than previously reported. After revisions, job gains have averaged 205,000 over the last 3 months.
Also recall my August 21 report: BLS Revises Payrolls 501,000 Lower Through March.
Those revisions are not reflected in the charts. The newer revisions are.
BLS Jobs Statistics at a Glance
- Nonfarm Payroll: +266,000 – Establishment Survey
- Private Nonfarm Payroll: +254,000 – Establishment Survey
- Employment: +83,000 – Household Survey
- Unemployment: -44,000 – Household Survey
- Involuntary Part-Time Work: -15,000 – Household Survey
- Voluntary Part-Time Work:-24,000 – Household Survey
- Baseline Unemployment Rate: -0.1 to 3.5% – Household Survey
- U-6 unemployment: -0.1 to 6.9% – Household Survey
- Civilian Non-institutional Population: +175,000
- Civilian Labor Force: +40,000 – Household Survey
- Not in Labor Force: +135,000 – Household Survey
- Participation Rate: -0.1 to 63.2% – Household Survey
BLS Employment Report Statement
“Total nonfarm payroll employment rose by 266,000 in November, and the unemployment rate was little changed at 3.5 percent, the U.S. Bureau of Labor Statistics reported today. Notable job gains occurred in health care and in professional and technical services. Employment rose in manufacturing, reflecting the return of workers from a strike.”
Unemployment Rate – Seasonally Adjusted
The above Unemployment Rate Chart is from the BLS. Click on the link for an interactive chart.
Nonfarm Employment Change from Previous Month by Job Type
Nonfarm Employment Change from Previous Month Trends
Hours and Wages
Average weekly hours of all private employees were steady at 34.4 hours. Average weekly hours of all private service-providing were steady at 33.2 hours. Average weekly hours of manufacturers was rose 0.1 hours to 40.5 hours.
Average Hourly Earnings of All Nonfarm Workers rose $0.07 to $28.29.That’s a gain of 0.25%.
Average hourly earnings of Production and Supervisory Workers rose $0.07 to $23.83. That’s a 0.29% gain.
Year-Over-Year Wage Growth
- All Private Nonfarm rose from $27.43 to $28.29, a gain of 3.1%.
- All production and supervisory rose from $22.99 to $23.83, a gain of 3.7%.
For a discussion of income distribution, please see What’s “Really” Behind Gross Inequalities In Income Distribution?
Birth Death Model
Starting January 2014, I dropped the Birth/Death Model charts from this report. For those who follow the numbers, I retain this caution: Do not subtract the reported Birth-Death number from the reported headline number. That approach is statistically invalid. Should anything interesting arise in the Birth/Death numbers, I will comment further.
Table 15 BLS Alternative Measures of Unemployment
Table A-15 is where one can find a better approximation of what the unemployment rate really is.
Notice I said “better” approximation not to be confused with “good” approximation.
The official unemployment rate is 3.5%. However, if you start counting all the people who want a job but gave up, all the people with part-time jobs that want a full-time job, all the people who dropped off the unemployment rolls because their unemployment benefits ran out, etc., you get a closer picture of what the unemployment rate is. That number is in the last row labeled U-6.
U-6 is much higher at 6.9%. Both numbers would be way higher still, were it not for millions dropping out of the labor force over the past few years.
Some of those dropping out of the labor force retired because they wanted to retire. The rest is disability fraud, forced retirement, discouraged workers, and kids moving back home because they cannot find a job.
Strength is Relative
It’s important to put the jobs numbers into proper perspective.
In the household survey, if you work as little as 1 hour a week, even selling trinkets on eBay, you are considered employed.
In the household survey, if you work three part-time jobs, 12 hours each, the BLS considers you a full-time employee.
In the payroll survey, three part-time jobs count as three jobs. The BLS attempts to factor this in, but they do not weed out duplicate Social Security numbers. The potential for double-counting jobs in the payroll survey is large.
Household Survey vs. Payroll Survey
The payroll survey (sometimes called the establishment survey) is the headline jobs number, generally released the first Friday of every month. It is based on employer reporting.
The household survey is a phone survey conducted by the BLS. It measures unemployment and many other factors.
If you work one hour, you are employed. If you don’t have a job and fail to look for one, you are not considered unemployed, rather, you drop out of the labor force.
Looking for jobs on Monster does not count as “looking for a job”. You need an actual interview or send out a resume.
These distortions artificially lower the unemployment rate, artificially boost full-time employment, and artificially increase the payroll jobs report every month.
Final Thoughts
Last month I commented “Looking ahead, the GM strike is over.”
This month we can say the end of the GM strike provided a one month or perhaps 2-month lift in jobs. Next month will tell.
Seasonal adjustments on top of GM further skewed things.
This was a good report but not as good as it looked. The household survey only reported a gain of 83,000 jobs.
Mike “Mish” Shedlock


Herkie – –
I also am skeptical of the BLS numbers.
However, the BLS puts the government employment increase for November at 12,000 jobs, relative to Table B in their news release. https://www.bls.gov/news.release/empsit.b.htm
Flatlaxity
Hey all, this report is total bullshit and we all know it, the private sector employment report came in this week at one of the most anemic we have seen since the GFC and I do believe the Trump administration was ready for that….
The Census Bureau needs to hire about 500,000 census takers across the country in 2020.Oct 22, 2019
We are now less than three weeks from the start of the 2020 census. Those people are being put on the payroll now, recruitment, interviews, all that already happened since summer and the people who got the nod were basically told they would start in January 2020, so a bunch of them were put on a few weeks early because the WH knew the December hiring figures were going to be really bad.
That is why they do not show up in the ADP report but do show up in the Friday employment report that does show government employees. And, most of the people hired will be out of work in 6 months, at least half of them, then week by week another 10k will be let go till about election day next year.
I saw this coming more than two years ago because it is the same EVERY year ending in zero. But, for the government to pretend this is somehow an economic victory, or for Wall Street to use it as an excuse to party like it is 1999, or 2006 is beyond the pale.
The fact that everyone is praying thanks to Trump for the best employment situation in 60 years all because a headline claims we are hiring at near record pace this late into an expansion when that is demonstrably not true means that if you have any brains at all you will recognize that everything economic you read is just bullshit. That should scare you, but, the upside of all this is that half million people put on temporary payrolls with the federal government are also going to go OFF the payrolls going into election day next fall. We will see where the chips fall, because all of those people will be elegible for unemployment compensation for a minimum of six months when they are let go. We will see the unemployment rate ticking higher every week from late July into election day.
The Census Bureau needs to hire about 500,000 census takers across the country in 2020.Oct 22, 2019
https://www.npr.org/2019/10/22/772024160/a-half-million-2020-census-jobs-will-they-be-filled-in-time
I keep an eye on the job market. Most jobs in technology are government related (Mil/DoD). Contractor jobs far outnumber perm jobs. Jobs by tech startups are nowhere to be seen. Companies and their employee looking to start their own companies see little future growth to justify taking risks of expanding.
As you say, Mish, the ADP data comes in at 67,000 jobs added, compared to the BLS’s Establishment Survey of 254,000. A small part of the difference is that ADP doesn’t include the government jobs added which the BLS pegs at +10,000.
Over time the ADP and BLS data pretty much agree, but can vary widely month-to-month. https://www.cnbc.com/2016/10/06/employment-dont-count-on-adp-payroll-figures-to-predict-the-friday-jobs-report.html and Figure 23 in today’s Ed Yardeni “U.S. Economic Indicators: Employment” booklet https://www.yardeni.com/pub/employmentcb.pdf With regard to the latter the ADP data swings much lower than that of the BLS over the last 6 months.
A good review of today’s BLS numbers can be found at the Capital Spectator site: http://www.capitalspectator.com/is-the-november-payrolls-report-as-good-as-it-looks/#more-13270 “…the econometric outlook for private payrolls still implies that the trend will gradually weaken in the months ahead. Using today’s figures, a fresh run of The Capital Spectator’s combination forecasting model for employment shows the one-year change ticking down in December to 1.5%, with a generally downside bias expected to continue in 2020…”
ADP private payrolls are ghastly and the administration knows this going into impeachment proceedings and conveniently the government needs to hire 500,000 temporary workers for the census. So, they just moved a couple hundred thousand hires up by a few weeks. When it comes to his own image jobs are the single most powerful image builder and vote getter for a president, there is only one other metric of economics more powerful and that is equity market record highs. Because as we all know if the stock market is UP then the economy must be great right? So, they hire a couple/few hundred thousand hires up a few weeks and why not, it isn’t Trump’s money is it?
I can tell you this, the only people taking census jobs here in southern Oregon are those that look forward to the unemployment checks for 6 months after the job is over because you can’t live on 13 bucks an hour here. Work for six months at what should be less than minimum wage, collect UI checks for six months for doing nothing at all, and thet gets these skaters to the next marijuana planting season.
The thing that leaps up at me is that long-term Unemployment Rate chart. Not only did the downtrend start years before Trump, but also there is no appreciable difference in rate of change. Maybe Presidents and the elected part of the Executive (versus the permanent Admin. Staters) don’t do much more than move the needle in the media and electoral realms, aka gossip?
From looking at…
https://www.bls.gov/news.release/empsit.t09.htm
It looks like full time jobs went from 131,990->131,385 and part time went from 27,077->27,560. Unadjusted. How is this viewed as a good jobs report?
Unless I’m misreading the report.
Seasonal factors also skewed the report. Thanksgiving was very late in the month, in fact, on the last possible day, November 28.
How does the date on which Thanksgiving falls impact the jobs report?
You would think that with all these health care jobs being created and with health care representing an ever larger share of GDP, life expectancy here in the US would not be declining year after year. But it is.
Lifestyle. We have the most obese population in the world combined with the most drug abuse. If they ever have single payer it would be nice if they gave a tax rebate to those who took fulfilled healthy lifestyle practices. It may incentivize people.
Despite the fact that the diet of the average American is awful, and that as a result Americans are obese, if you subtract out non-medical condition deaths (cars, guns, other accidental deaths), then the American Healthcare system actually looks very good.
Lifestyle definitely plays a role, but it’s the suicides and overdoses that move the needle on life expectancy. If some guy doesn’t take care of himself and dies at 67 instead of 74, it’s not nearly as significant as another guy who overdoses at 25 or shoots himself at 35. Enough young people are dying to impact the overall averages.
It’s sad stuff, but that’s where we are.
Also, iatrogenic causes of both chronic and acute diseases. Or put another way: a high percentage of pharma industry products are pathogenic. Sad but true.
Or put another way: if you are sick, the last place you want to end up is in a hospital!
Umm…why doesn’t occurr to people here to mention the elephant in the room?
Lack of access to healthcare is why life expectancy if falling.