
The savings rate is up, inflation tame, and real spending is weak. Five charts.
Please consider the BEA’s Personal Income and Outlays report for April 2025.
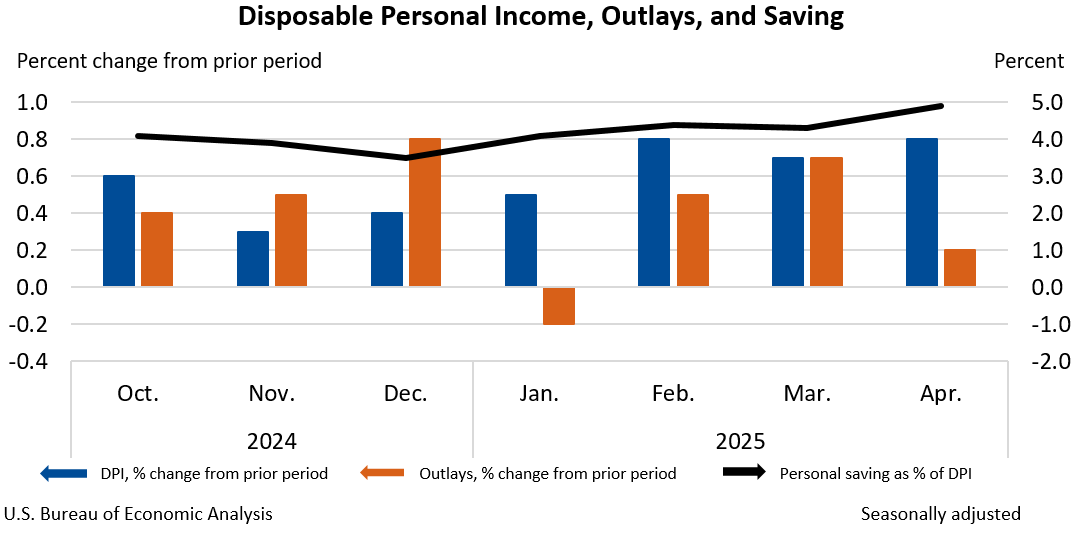
Reported Details
- Personal income increased $210.1 billion (0.8 percent at a monthly rate) in April
- Disposable personal income (DPI)—personal income less personal current taxes—increased $189.4 billion (0.8 percent)
- Personal consumption expenditures (PCE) increased $47.8 billion (0.2 percent).
- Personal outlays—the sum of PCE, personal interest payments, and personal current transfer payments—increased $48.6 billion in April.
- Personal saving was $1.12 trillion in April and the personal saving rate—personal saving as a percentage of disposable personal income—was 4.9 percent.
Those numbers are interesting but it is real (inflation-adjusted) spending and income that matters.
I have the pertinent charts below, but here are some additional interesting charts from the BEA.
Changes in Monthly Consumer Spending

Those are nominal, not real expenditures.
Personal Income and Related Measures

To arrive at real, subtract the PCE price index change from current-dollar (nominal) numbers.
The PCE price index was tame, as widely expected, up only 0.1 percent.
Because the BEA only reports numbers to a single decimal point, there are often rounding errors.
Real DPI rose 0.7 percent. That’s a big number, but we need to dig further because that still does not tell us what we need to know.
Personal Income and Real Personal Income

Nominal personal income (dashed lines) is on a tear . But it’s real income that feeds GDP.
I highlighted Real PI Minus PCTR because that is the number the NBER uses to determine recessions.
PCTR stands for Personal Current Transfer Receipts, income for which no work was performed. This includes Medicare, Medicaid, food stamps, housing support, and Social Security payments.
Personal Income Six Ways

Personal Income Details
- PI: +0.84 percent
- DPI: +0.82 percent
- Real PI: +0.72 percent
- Real DPI: +0.74 percent
- Real PI minus PCTR: +0.26 percent
- Real DPI minus PCTR: +0.21 percent
Real personal Income was strong, but much of the growth is PCTR.
The BEA lists Real PI minus PCTR as +0.3 percent. To two decimal places, I calculate +0.26 percent.
Related Posts
May 29, 2025: Significant Revisions to First-Quarter GDP, Income Declines 0.2 Percent
Gross Domestic Income drops, Investment higher, real final sales lower.
May 29, 2025: Corporate Profits Suffer the Largest Drop Since the Fourth Quarter of 2020
Corporate profits fell by $118 billion, a decline of 2.95 percent.


As regards the headline of the article? People are saving for the economic winter of another massive trump recession?
Regarding corporate profits falling 3% or $118 billion? Tip of the iceberg as imports fall and sales and jobs evaporate.
Meanwhile, China is putting on a world wide trade show of mutual co-operation with all of the nations that trump is alienating and building a far stronger trading block to replace what it sold to the U.S.
The US public and private sector economies are effectively a 90% ponzi scheme. The financialization of the economy is to blame. Productivity was offshored and outsourced in selling the economy out to be financialized more quickly. The Fed, politicians and presidents are to blame. The US truly needs a real technocrat to fix all the problems it has. Maybe it will happen one day but there are too many forces in Washington preventing real change.
Progress against institutional corruption?
Kennedy cited Richard Horton, editor-in-chief of The Lancet. Horton has written that “much of the scientific literature, perhaps half, may simply be untrue,” with issues such as conflicts of interest and small sample sizes plaguing the field.
Kennedy also referenced comments from former New England Journal of Medicine editor Marcia Angell, who wrote in 2009 that “it is simply no longer possible to believe much of the clinical research that is published, or to rely on the judgment of trusted physicians or authoritative medical guidelines.”
The current publication system means researchers must pay to get their research published, and often involves pharmaceutical companies funding research that supports their products, Kennedy said.
https://www.youtube.com/watch?v=sODZSAuxTTw
So when does PCTR fall precipitously in your charts? We are cutting subsidies for HUD, SNAP, medicaid, etc. When does it all actually go into effect? Most of these benefits explicitly spell out that illegal immigrants are not eligible, yet they payouts continue, nonetheless!
If, as I suspect once Mish posts charts on it, the rise is due to the number of SS claimers increasing (as MPO45v2 noted above and has talked about for a couple of years) then it’s going to be quite some time before it falls by any significant amount because boomers reaching SS age is going to continue for another 5-6 years.
What is Humphrey’s Executor? A look at the 90-year-old Supreme Court decision Trump is targeting
https://www.theusconstitution.org/news/what-is-humphreys-executor-a-look-at-the-90-year-old-supreme-court-decision-trump-is-targeting/
Looks like the recipe is the same. More debt incurred by government. Rinse and repeat. The economy is so broken in many ways because productivity no longer seems possible nor does anyone seem to care.
Yes and a quick look as the social security snapshot shows how out of control social security spending is and ditto for medicare.
Jan – 121,018 billion/month
Apr – 128,736 billion/month
6% growth from Jan to Apr for just social security. That’s 18% annually, great for a return on investment bad for social debt and it will continue to grow through 2030 and beyond until it implodes.
source: https://www.ssa.gov/policy/docs/quickfacts/stat_snapshot/2025-04.html
Got exit strategy?
I think some people in power have a plan: turbo cancer. Remember to get your booster.
The Covid vax is definitely the exit strategy for the government. Many people paid into ss but won’t ever collect as they’re dead or will be dead before they’re eligible to collect.
It’s time for them to become disabled and start collecting Social Security disability right now. As the early adopters have done.
If we euthanize all those who type comments on blogs then Social Security would go heavily into the black and the average IQ of the Human race would increase by a nice amount.
Don’t put yourself down like that.
COLA increases happen once a year. The increase has already been annualized.
The growth is coming from the number of people being added to the social security rolls not COLA.
18%/yr? Roughly the same number are added as removed each year. I’ll spot you a 3% spread, and that’s conservative in your favor.
Last year saw a growth of 2% in total beneficiaries, BTW. And that includes illegal immigrants pulling SSI benefits.
Who the f*** cares about the growth of total beneficiaries when what matters is the cost. I provided the link to the data so why don’t you do some math.
By 2030, social security alone will cost $2.02 trillion dollars at a present 6% growth rate. Medicare will likely be $3+ trillion. That’s just two social programs and just for boomers.
Throw in trillions in interest on debt and you are f*****!
Got exit strategy?
I did the math. You did not.
Borrow what is needed right now.
The kids will have great well-compensated jobs and pay it back.
Oh, wait…
Look, a squirrel…
Bring back Fauchi, Scarf Lady and Walenski to kill the rest of them off for you. Works the same way if you kill off the old ones collecting and / or the younger ones paying in, “suddenly”.
That’s millions per month, not billions.
Millions, billions, it all adds up.
Pretty soon you’re talking about real money.
But doesnt Social Security have its own trust fund, funded by workers. I know recently the payouts have started exceeding the income, but there is still 2.6 trillion savings in the trust fund. Enough to last projected to around 2033, not long, so yes its an issue. Then the payouts will, all else equal, have to decrease to whatever the fund income is. Should be interesting how much they decrease.
=Please consider the BEA’s Personal Income and Outlays report for April 2025.
I am always amused that REAL PEOPLE, ADULT PEOPLE w/ university diplomas WOULD BELIEVE that it is possible to calc such huge wide spread metrics (income savings sales etc) w/ any level of accuracy for HUGE COUNTRY LIKE USA (it is not Monaco or Vatican :)))) )
= 330+ MIL PEOPLE
= over 250 mil WORKING PEOPLE
= $trillions of import -export per year
= millions of small-middle size companies , etc etc etc
=====
to put into perspective ABOUT LOW LEVEL OF TECHNOLOGY USED by gov entities
for example,
BLS (LABOR DEPARTMENT) still counts major labor metric like UNEMPLOYMENT %RATE by cold calling about 100 thous people, and later next month(s) re-cal using business employee salary records!
but initially it is cold calling , AND IT IS 21TH CENTURY!
alx
Do you have a better way?
Alex is an AI bot but not one of the sophisticated ones. It hallucinates a lot. That’s how you tell it’s a bot. The sophisticated ones are really scary.
There are 164 million working people. Your 250 million figure is how many people are of working age. There are over 100 million people of working age who are not working.
I do not believe that they are cold calling 100K people. It’s a huge task. Maybe they mean they have a pool of 100K candidates. (Surveys for example are all using the same pool of 60K candidates). Maybe they’re calling about 3,000 people each time, tops.
The really interesting chart is the ‘Changes in Monthly Consumer Spending’ one.
Housing and Health Care spending skyrocketed. Suggested rents are really going up or forbearance is finally ending for anyone still getting it (free loaders). For homeowners it would seem maintenance costs also skyrocketed.
In order to pay for those things consumers basically stopped repairing cars, buying insurance (life/car/home etc) and donating to charities.
That can’t go on at this rate for long before things will seriously break.
Just watched Jaime Dimon at the economic forum on CNBC, guy was all gloom and doom so we’ll see where that goes.
He needs a facelift, like Madonna.
It’s classic inflation.
As in Wac-a-mole style where 1st one sector goes up, then another follows it then another and on and on until the 1st one goes up again?
Is it really appropriate to subtract nominal PCTR from real DPI, or other real income figures? The conclusions would change a bit if you used real PCTR, no? Or is the PCTR series you used already inflation adjusted? Just trying to get a handle on this and make sure I understand.
You asked a good question but I did this accurately. My calc matches BEA.
https://fred.stlouisfed.org/series/W875RX1
To see, click on edit chart and change the unit to Percent Change.
This is a feed to the NBER recession determination.
It is very easy to make a mistake like you suggested, so I appreciate the question.
It is beyond idiotic to get a negative click for that reply.
There is a troll clicking stuff negative, I hope he/she is having fun.
With PCTR, I googled but couldn’t find a breakdown of how much each component contributes to that (in other words is the rise in PCTR due to higher SS payouts or more SNAP assistance or increased UI payments etc). Is that available?
Good question. I want to do this too.
I have a great chart started, if I can find more data.
The trend is what you would expect. I can say that right now.
I found the key chart.
Will do a post on this
I created some eye-opening charts for TT.
Will do a post – likely Monday, perhaps sooner.
I suspect the trend is SS payouts which is going to tickle MPO45v2 to death.
I have a breakdown of SS, Medicare, Medicaid, VA benefits, and unemployment benefits in dollars, percent, and real percent over time starting 1959.
Great charts.
I don’t have SNAP.