
I am pleased to report a month-over-month home price decline. But don’t get too excited. 
Case-Shiller Chart Notes
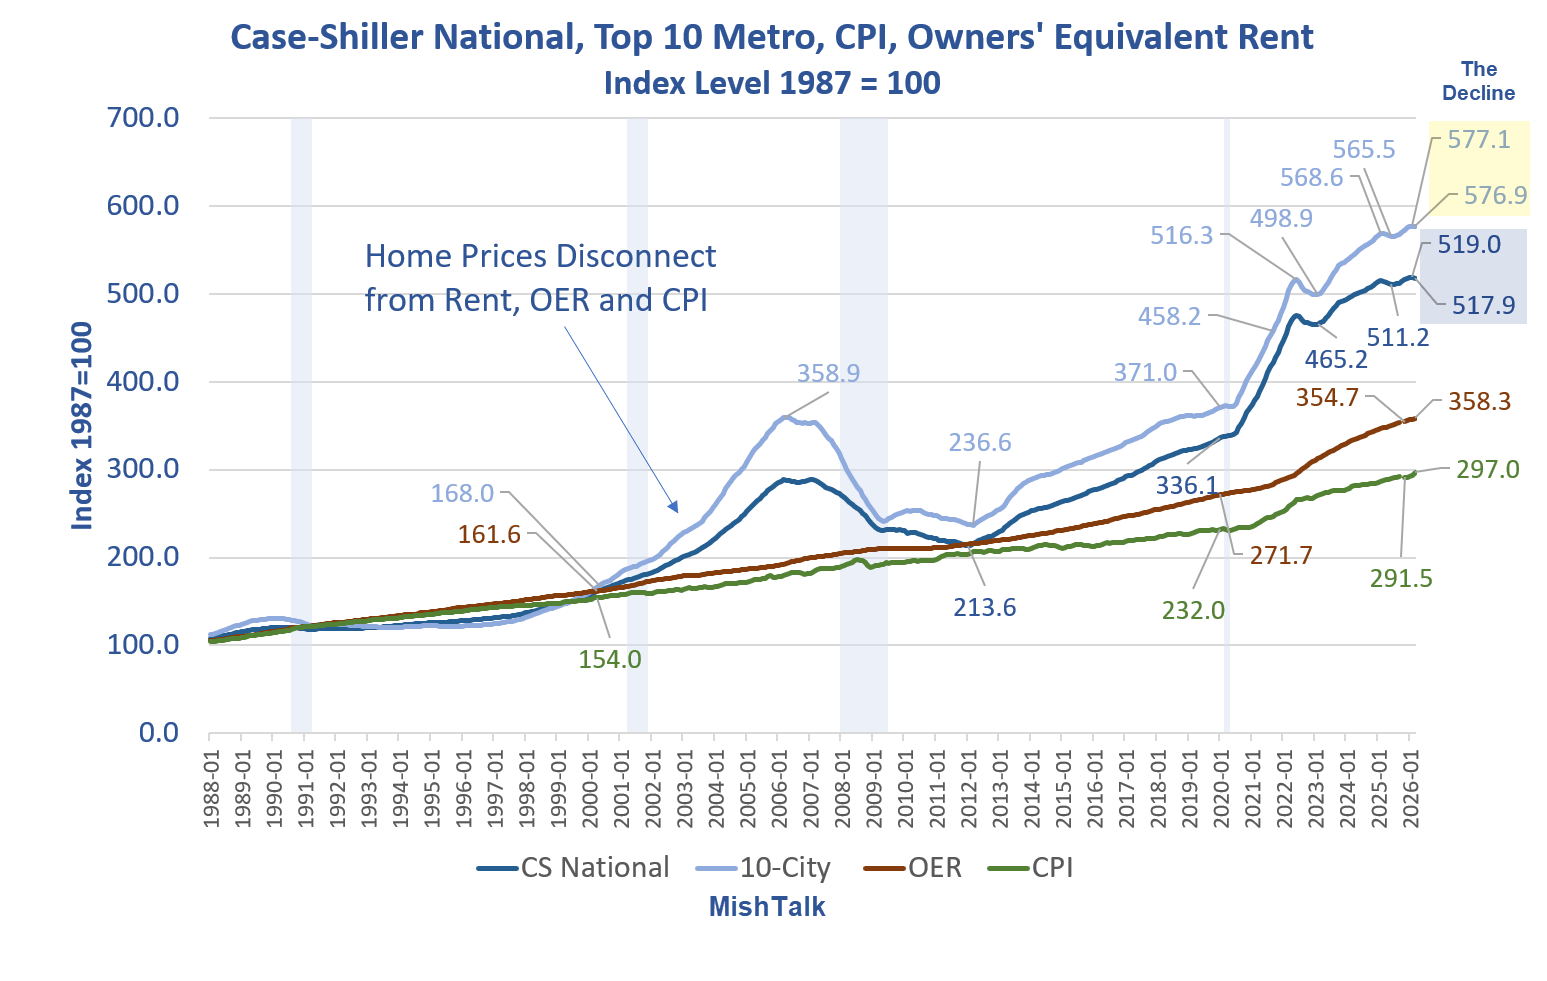
- CS National: Case Shiller National Home Price Index
- 10-City: Case Shiller 10-City Home Price Index
- CPI: Consumer Price Index
- OER: Owners’ Equivalent Rent, the price one would pay to rent their own home unfurnished without utilities
All of the above are seasonally adjusted.
Case Shiller March Report
Please note Case-Shiller Index Reports Annual Gain in March 2026
- The S&P Cotality Case-Shiller U.S. National Home Price NSA Index posted a 0.7% annual gain for March 2026, down from a 0.8% rise in the previous month.
- More than half of major U.S. metropolitan markets posted year-over-year price declines in March, with Seattle (-2.5%) displacing Denver as the weakest market and Chicago (6.1%) remaining the strongest.
- For the 10th consecutive month, inflation outpaced national home price appreciation, with March CPI running 2.6 percentage points above the 0.7% annual gain, extending the streak of negative real home price returns.
“More than half of the 20 major U.S. housing markets recorded year-over-year price declines in March, reflecting a broadening and deepening housing slowdown,” said Nicholas Godec, CFA, CAIA, CIPM, Head of Fixed Income Tradables & Commodities at S&P Dow Jones Indices. “The S&P Cotality Case-Shiller National Home Price Index edged up just 0.7% in March from a year earlier, decelerating from February’s 0.8% rate. With consumer inflation accelerating to roughly 3.3% in March, U.S. home values have now fallen in real terms for the 10th consecutive month, underscoring an ongoing erosion of inflation-adjusted housing wealth.
“The geographic divergence remains stark,” Godec continued. “Midwest and Northeast markets are sustaining modest growth, while much of the Sun Belt and Western regions are still seeing declines. Chicago led all cities with a 6.1% annual gain, followed by New York (4.0%) and Cleveland (3.0%). In contrast, Seattle’s 2.5% year-over-year decline was the steepest in March, with Denver (-2.0%), Tampa (-1.9%), Dallas (-1.7%), and Phoenix (-1.6%) joining Seattle among the weakest performers. Even Los Angeles (-1.6%) and Washington (-0.1%) turned negative. The spread between the strongest and weakest markets – 8.6 percentage points, from Chicago’s +6.1% to Seattle’s -2.5% – highlights how localized this housing cycle has become.
“Monthly price movements offered a seasonal spring lift but little underlying momentum. Before seasonal adjustment, the National Index climbed 0.7% from February, and even double-digit composite markets like the 10-City and 20-City posted strong March gains (1.2% and 1.0% NSA, respectively). Yet after seasonal adjustment, the National and 20-City indices both slipped 0.2%, and the 10-City ticked down 0.03%, confirming that demand remains soft as we head into spring. The latest six months saw only a negligible 0.3% rise in national home prices, barely keeping pace with the 0.3% in the prior half-year – a sign of a housing market nearly at a standstill.
Case-Shiller National, Top 10 Metro, Percent Change From Month Ago

Case-Shiller Home Prices Percent Change Year-Over-Year

Slowdown in Perspective

The above chart and the lead chart put the slowdown into proper perspective.
A 50 percent decline in home prices is needed before we can talk about affordability.
Between 1988 and 2000, home prices rose in sync with rent, OER, and the CPI. A huge series of Fed mistakes, first by Bernanke, then repeated by Powell led to home prices soaring wildly.
Interest Rates vs Case-Shiller National Home Price Index

In response to the dotcom bubble recession and then again in 2020, the Fed slashed interest rates to ridiculously low levels.
I calculate real (inflation-adjusted) interest rates two ways, first against the CPI, and second substituting home prices for OER in the CPI.
In the dot-com bubble real interest rates were negative 4.2 percent. The Fed repeated this error, and then some in 2020 with real interest rates of -9.76 percent by my measure and -7.46 percent straight up.
Now, the housing market is fully broken with few willing to trade a 3 percent mortgage for a 6 percent mortgage.
The Fed has never admitted either error. And consumers are increasingly in trouble with the inflation that the Fed and Congress cooperated to create, the Fed by policy and Congress by spending.
Related Posts
May 12, 2026: CPI Hotter than Expected, Highest in Three Years, a Genuine Disaster
Inflation in April was another scorcher. Here are some month-over-month and year-over-year charts.
May 17, 2026: Ground Beef Soars to $6.90 per Pound. Trump Has No Winning Actions
Trump is boxed in on agriculture and the War in Iran.
May 26, 2026: Consumer Credit Stress Is Comparable to the Great Recession
Auto delinquencies are at a new record and credit cards are near record high.


Case Shiller has nothing to do with homebuilders. Nor should it.
Case Shiller measures repeat sales of the same house over time.
Otherwise you are comparing prices of varying lot sizes, locations, amenities, features and even rooms. CS is the gold standard, but as I said, it lags.
CS current month is March. It’s now May, heading into June. March represents sales in January-February-March. Add that all up and you are realistically looking at prices 5 months ago.
But there is nothing better than repeat sales of the EXACT same house over time to know what prices are doing.
Good. Heading the right direction.
Mish, might we pray for A.I. TO THE RESCUE?
In other words, since we are building 4 Million Acres of Data Centers, why not use A.I. to tabulate and give us REAL TIME R.E. sales and lagging only 30 days?
OH, A.I. is all bullshit? OHHHH, OK! Capisch.
I just saw a Naples, FL condo go for $1.3 million that they paid $2.0 for 18 months ago and a Naples, FL home on the water go for $3.2 million that was originally listed for $6.5 million two years ago.
Profound losses in the coastal Florida markets related to soaring tax and insurance costs.
The condo sale was 3 months ago and the home sale is just about to close (both aged out boomers).
Look for the upcoming CS reports to show some real declines in property prices.This may trigger a freeze on buying and lower prices ~ despite inflation.
In the upper midwest, I was the only (all cash) bidder on a 320+ acre farm/forest property at .38 cents per dollar of debt. End of the dirt road access with a wicked washout, downed trees & power lines, no crops and serious weed issues. Some wetland, some un-farmable slopes (with hardwood forest). Upgraded but stinky older farmhouse and one really nice outbuilding plus misc grain, implement, fuel, fertilizer storage.
Family broken by several generations of alcohol/substance abuse. Serious Trump supporters…
Countering that mess are two nice springs that combined provide over ??? gpm of crystal clear, 43 degree fossil water.
Poorly managed farms are in serious trouble! Some have underlying value that is masked behind weeds, depleted soils, broken machinery, debt and back taxes.
In this case, I can fix stupid!
Almost 5:00! Gonna be a fun, long day with the excavators!
The amazing thing is that the areas of the country that were still seeing hefty price increases over the last year (Connecticut and Wisconsin for example) have entered panic blow off top mode with the sudden increase in mortgage rates.
Those who are planning to buy soon feel like now is their last best chance to grab something, even if they have to pay a crazy high price in a bidding war. It’s insane.
How insane? https://www.realtor.com/realestateandhomes-detail/West-Hartford_CT_06107_M31576-55517
Look at the property taxes on that beauty and look at the description:
“IMPORTANT: This property is occupied and cannot be shown, do not make any attempts to go on the property – view from the street only. ALL OFFERS must be CASH ONLY. There is NO FINANCING, AS IS, NO INSPECTIONS. Do not step on the property or communicate with the occupants.”
Amazingly, they just dropped the price by $10,000. A sign the CT bubble is over? Perhaps.
The insanity is also reflected in the wide range of estimated values($455K to $622K). If the house truly has been sitting on the market for 365 days, then even the lowest estimate and asking price are too high.
A house with free crackheads? Sign me up!
And then there are condo’s:
Trump’s fault! House prices are only supposed to increase!
I gave you a thumbs up for that. Home values and “affordability” are like a seesaw. If one goes up, the other goes down.
Trump has promised homeowners to make their homes worth more
Trump has promised would-be homebuyers to make their homes more affordable
I’m sure he can do all of both /s
OT but Paxton beat Cornyn in Texas. Let the games begin!
The fumblementalist Christians will be out in war parties. It’s going to set records for viciousness.
Won’t Christians be focused on Pope Leo’s call for a new Crusade against AI?
One can always find some opinion that one likes. I’m waiting for an encyclical called “Desine Liberos Mutilare”.
The Case-Schiller chart is like a year behind reality in my view, maybe more. Very dumb methodology, so dumb it seems purposeful.
Best methodology there is. Very accurate, but lagging ~5 months.
I don’t know MISH, who am I to disagree but it seems like it doesn’t capture what the homebuilders are “doing to the market”, nor the massive concessions/upgrades (which are effectively real price declines), and not the interest rate buy downs either (more de facto price cuts). In other words, to me it misses reality by a lot, until it’s so late to the party it doesn’t really matter.
New houses are almost a separate category. The vast majority are spec houses, cheaply built on tiny lots in less desirable locations, burdened with an HOA, mello roos and other nonsense.
This has nothing to do with homebuilders. Nor should it.
Case Shiller measures repeat sales of the same house over time.
Otherwise you are comparing prices of varying lot sizes, locations, amenities, features and even rooms. CS is the gold standard, but as I said, it lags.
CS current month is March. It’s now May, heading into June. March represents sales in January-February-March. Add that all up and you are realistically looking at prices 5 months ago. But there is nothing better than repeat sales of the EXACT same house over time to know what prices are doing.
Very much agree on the massive concessions/upgrades not being fully captured by C/S. Their methodology on this is very inaccurate, and they effectively just guess at the condition and the cost to upgrade.
Right. It may be “unassailable” data, but is it the right data – the thing people actually want to know? What good is it if it shows a line pointing up for two plus years after prices peaked? All while the FRED MSPUS chart shows the REAL picture of the housing market (and even that one was egregiously manipulated to smooth out the euphoric spike of 2022).
What is that with the fifty year mortgage?
I’ve been waiting for years to buy more rental properties but the insurance, maintenance and property taxes are so out of whack that it only makes sense in very few markets. I’m better off buying bonds or TLT, sell calls on it and make 10 to 12% than buy a rental property and deal with all the headaches.
At this point, you can’t count on the appreciation because even if homes do appreciate, so do insurance, property taxes and maintenance. It’s a vicious cycle.
Better off getting rich trading paper.
And then you got to worry about one more thing…
Do worry, Trump & Walrus will find a way to make things even worse.™
Worse than all those typical expenses are sudden changes in laws and the regulations communists will impose on investors.
The economic trends under taco have become increasingly “consistent.”
Round and round the bowl we swirl.