

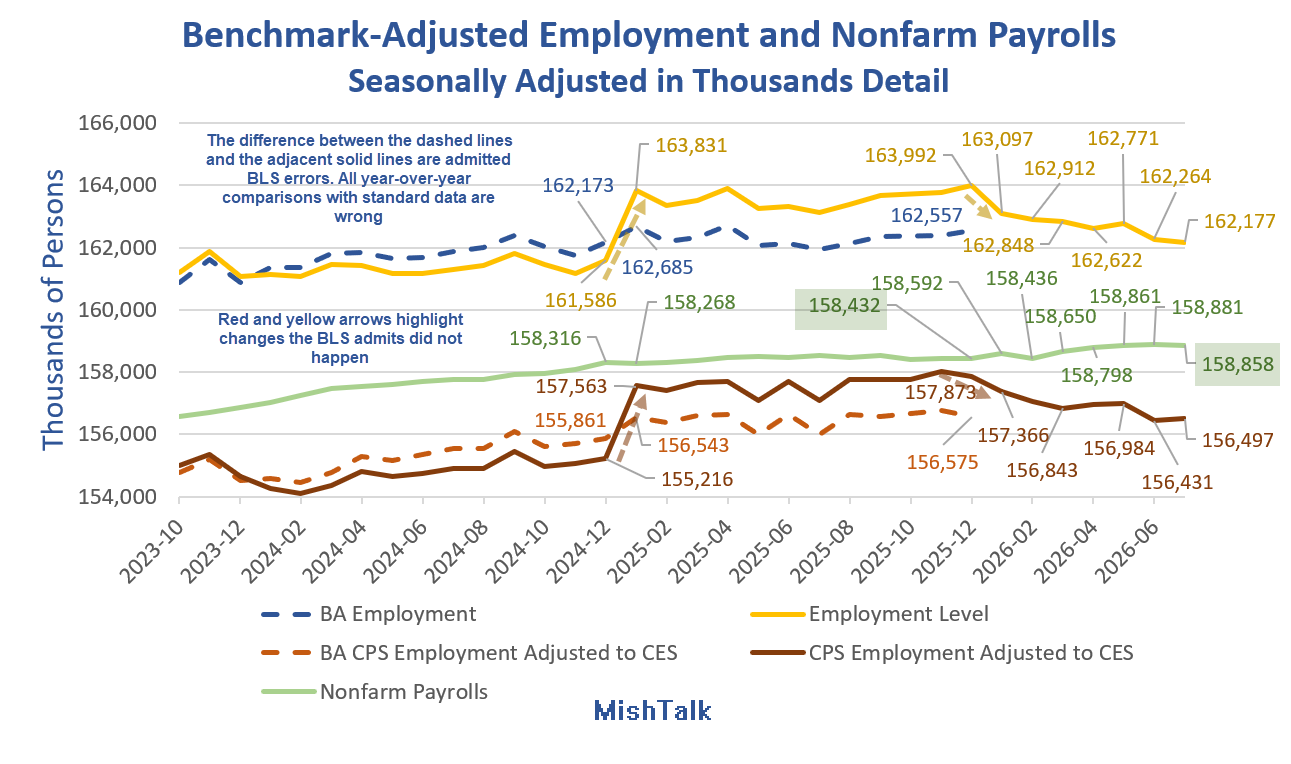
On top of the weak headline numbers, revisions were negative 103,000.
Understanding the Lead Chart
Note: If you have seen this explanation, please skip to down to the subtitle “Initial Thoughts” to continue reading.
Every January (typically), the BLS has annual revisions to nonfarm payrolls and household population employment. The BLS does not back revise the household charts.
Because the BLS does not back revise, we see ridiculous numbers such as employment rising by over 2 million in a month (first yellow arrow).
To correct for the population adjustments, the BLS provides an adjustment series to normalize employment levels to match nonfarm payrolls. The BLS calls this “experimental” data but the regular posted data is admitted nonsense.
The experimental series is LNS16000000, “Employment Adjusted to CES Concepts“.
For 2024, the BLS admits that it undercounted employment by 2 million. Instead of parsing that out in the correct months, the BLS plowed the entire adjustment into January of 2025.
For 2025, the BLS admits that it overcounted employment by 1.4 million. Instead of parsing that out in the correct months, the BLS plowed the entire adjustment into January of 2026.
We did not suddenly add 2.245 million jobs in January of 2025, all US-Born. (Difference between the dashed blue line and the yellow line).
Moreover, there is no valid historical data on full vs parttime employment, on foreign born employment, and many other BLS data series. And there won’t be. There are no back adjustments key data components.
All posts on foreign-born employment, parttime employment, etc., suffer this flaw. All year-over-year (or December-to January) analysis you find on these stats is permanently flawed.
2025 Experimental Data
In April, the BLS released Experimental series accounting for January 2026 population control effects.
(Official CPS estimates for December 2025 and earlier months have not been revised, in accordance with usual practice.)
Experimental Series
In 2025, BLS produced new experimental time series measures to account for the size and timing of the large population changes reflected in the January 2025 population control adjustment.
The experimental series use the monthly time series (back to April 2020) available from the Census Bureau’s Vintage 2025 population estimates that form the basis of the January 2026 CPS population control adjustment.
The experimental series are smoother over time, as they do not show the annual effects of the population control adjustments that occur each January in the official series.
The experimental series adjusts data back to April 2020, the decennial census reference point.
Standard vs More Accurate Experimental Data
- Between December 2024 and January 2025, the standard data shows an increase of 2,245,000. The adjusted data shows a gain of 692,000.
- For December 2025, the employment level is a reported 163,992,000 vs the adjusted data at 162,557,000.
- By December 2025, the standard data employment level was overstated by 1,365,000. That did not happen in a single month. It was the result of cumulative months of bad data every month for a full year.
All standard year-over-year household data comparisons are nonsense. Comparisons between January and December of the prior year are also invalid.
Initial Thoughts
I will continue to use what the BLS refers to as “experimental data” because the official household data is admitted nonsense.
This report was a another disaster. Employment fell by 87,000 in July after declining over half a million in June.
The unemployment rate fell because another 264,000 left the labor force. In June, 704,000 left the labor force.
Economists expected a gain of 88,000. Counting negative revisions, the economy shed 126,000 compared to the initial June report.
Here are the latest, undoubtedly wrong, and soon to be revised monthly job report details.
Monthly Job Report Details
- Nonfarm Payroll: -23,000 to 158,858,000 – Establishment Survey
- Civilian Non-institutional Population: +116,000 to 275,282,000
- Civilian Labor Force: -264,000 to 169,094,000 – Household Survey
- Participation Rate: -0.1 to 61.4% – Household Survey
- Employment: -87,000 to 162,177,000 – Household Survey
- Unemployment: -178,000 to 6,916,000 – Household Survey
- Baseline Unemployment Rate: -0.1 to 4.1% – Household Survey
- Not in Labor Force: +381,000 to 106,189,000 – Household Survey
- U-6 unemployment: +0.0 to 7.9% – Household Survey
Nonfarm Payrolls Change by Sector

Nonfarm Payrolls Change by Sector in Thousands
- Nonfarm Payrolls: -23
- Manufacturing: +5
- Construction: +22
- Leisure and Hospitality:-40
- Private Education and Health Care: +25
- Professional and Business Services: +18
- Information: +11
- Financial: -14
- Retail: -19
- Wholesale: 5
- Government: -53
Government Jobs Breakdown
- State: +7
- Federal: -3
- Local: -57
A decline in government jobs is a good thing, but it is also an indication of cash-strapped local governments.
Construction is up as are professional and business services. Both are related to the AI boom.
Data centers and power are the only construction positives from a year ago. And growth in Professional and Business Services is AI rehiring. Companies expected too much out of AI.
Monthly Revisions
- The change in total nonfarm payroll employment for May was revised down by 66,000, from +129,000 to +63,000.
- The change for June was revised down by 37,000, from +57,000 to +20,000.
- With these revisions, employment in May and June combined is 103,000 lower than previously reported.
BLS Notes: “The 2026 Preliminary Benchmark Revision to Establishment Survey Data will be published on August 28, 2026. This is the same day that the first-quarter 2026 data from QCEW will be issued.”
“Official establishment survey estimates are not updated based on this preliminary benchmark revision.”
By standard practice, the BLS will leave the published data and charts in a known-to-be-wrong state. This is why I use the alleged “experimental” data.
Part-Time Jobs
- Involuntary Part-Time Work: +123,000 to 4,804,000
- Voluntary Part-Time Work: +152,000 to 22,770,000
- Total Full-Time Work: -106,000 to 133,553,000
- Total Part-Time Work: +138,000 to 28,764,000
- Multiple Job Holders: +139,000 to 8,693,000
The above numbers never total correctly due to the way the BLS makes seasonal adjustments. I list them as reported.
These numbers are highly unreliable for reasons noted above. Year-over-year comparisons are invalid, period. The BLS does not update these numbers in the experimental data.
Hours and Wages
- Average weekly hours of all private employees was flat at 34.3 hours.
- Average weekly hours of all private service-providing employees was flat at 33.2 hours.
- Average weekly hours of manufacturers was flat at 40.4 hours.
A tenth of an hour does not sound like much. But multiplied across 158 million, that’s a lot of hours.
Of course, this data is only as good as the data collection.
Hourly Earnings
This data is also frequently revised. Here are the numbers as reported this month.
Average Hourly Earnings of All Nonfarm Workers rose $0.02 to $37.62. A year ago the average wage was $36.47. That’s a gain of 3.2%.
Average hourly earnings of Production and Nonsupervisory Workers rose $0.04 to $32.40. A year ago the average wage was $31.31. That’s a gain of 3.2%.
Accurately counted, these gains are not close to keeping up with inflation.
By accurate counting I mean factoring in homeowner’s insurance, property taxes, and tips on food. All three are excluded from the CPI. The BLS weights on food at home vs away are also wrong.
Unemployment Rate

Alternative Measures of Unemployment

Table A-15 is where one can find a better approximation of what the unemployment rate really is.
- The official unemployment rate is 4.1 percent.
- U-6 is much higher at 7.9 percent.
Both numbers would be way higher still, were it not for millions dropping out of the labor force over the past few years.
Some of those dropping out of the labor force retired because they wanted to retire. Some dropped out over Covid fears and never returned. Still others took advantage of a strong stock market and retired early.
The rest is disability fraud, forced retirement (need for Social Security income), and discouraged workers.
The entire series is flawed by non-applied annual benchmark revisions.
The series is also flawed by poor response rates, deportations, illegals not answering phones, sampling errors and non-sampling errors.
Birth Death Model
Starting January 2014, I dropped the Birth/Death Model charts from this report.
The birth-death model pertains to the birth and death of corporations not individuals except by implication.
For those who follow the numbers, I retain this caution: Do not subtract the reported Birth-Death number from the reported headline number. That approach is statistically invalid.
Birth-Death Methodology Explained
I gave a detailed explanation of the model and why the usual calculation is wrong in my June 8, 2024 post How Much Did the BLS Birth-Death Adjustment Pad the May Jobs Report?
I repeat, do not subtract the birth-death number from the headline number.
Household Survey vs. Payroll Survey
- The payroll survey (sometimes called the establishment survey) is the headline jobs number. It is based on employer reporting.
- The household survey is a phone survey conducted by the BLS. It measures employment, unemployment and other factors.
If you work one hour, you are employed. If you don’t have a job and fail to look for one, you are not considered unemployed, rather, you drop out of the labor force.
Foreign-Born Employment
The numbers in my charts are seasonally adjusted. Foreign born employment is not adjusted, compounding comparison errors.
And we have no BLS revised data for foreign born employment. So, all such foreign and US-born comparisons with BLS data remain nonsense.
A second major problem with foreign-born employment is the BLS makes no distinction between US citizens who were foreign born and genuine foreign workers.
Net Job Creation by New Businesses Is Negative

For details, please see my May 4 post Net Job Creation by New Businesses Is Negative Once Again
More jobs are lost in closing businesses than gained in new businesses.
The Business Employment Dynamics (BED) data shows a net loss of 159,000 jobs for 2025 Q3 and a net loss of 321,000 jobs for 2025 Q2.
Negative numbers are not the norm outside of recessions.
The BED and QCEW reports are very accurate but lagging.

Comments on BLS Data
The BLS monthly data is garbage.I do the best with BLS data that I can, or anyone can.
The quarterly QCEW and Business Employment (BED)reports represent a 96 percent sample. But those reports lag by about 5 months.
The Birth-Death model that feeds the monthly jobs report is bogus. It has been screwed up since Covid, first underreporting jobs then overreporting them.
QCEW and BED data show more jobs are now being lost in closing businesses than gained in new businesses.
Annual revisions have been lower for two consecutive years.
However, there are hints from QCEW that the bulk of negative annual revisions may finally be in the past.
Final Thoughts
This was another miserable report.
One has to wonder how messed up the Household phone survey is due to response rates from illegal aliens. However, the establishment survey is very weak too, and that is not impacted by fear.
Private Education and Health Care had been the huge bright spot for over a year. It is now faltering as the lead chart shows.
Leisure and Hospitality is down another 40,000 in July after a decline of 61,000 in June. This is an indication people are eating out less.
There are no drivers for jobs and it shows in both the establishment and Household surveys.
Related Posts
July 31, 2026: How Much Did AI Spending Contribute to Second-Quarter 2026 GDP?
Five charts show the AI impact for every quarter starting 2025 Q1.
August 5, 2026: What Is Leading US Construction Spending? Hint, It’s Not Manufacturing
Construction spending details are a real eye opener.
August 5, 2026: ADP Report Shows the Only Job Growth Is in Businesses with 1-10 Employees
Growth is weak in four of five employer size categories.






























Employment is at a near steady state, no hiring, little firing. When I graduated from college in the early 90s it was the same situation. Thankfully the Reagan/Bush laffer curve lie broke and things were good for a few years, Clinton actually balanced the federal budget
Early 90s was a recession. This is why Perot ran and Bush lost and Clinton won. The economy we have now no way resembles that. Debt to GDP is well over 150% once you remove government spending from GDP. The US exonomy has low productivity now and no prospect in sight. Industries are fighting one another to preserve the zero sum nature of what we have. What we have now isnt sustainable or retrieveable.
“All your job are belong to us” says the AI Overlord!
Man selling product, “this can cure cancer, trust me!”
Methinks your AI predictions will shake out about as well as your Iran ones did.
I must be missing something. What have I been wrong on about Iran? List with bullets.
Iran is losing the war
Iran is worse off than it was six months ago
Iran is not leveraging its power with other local nations and militants
Iran and its allies are not ecstatic about this opportunity to claim shipping
Iran is making Trump and his toadies look like winners
I could go on for days
All of that is true and correct. [Shrug]
I’ve proven these points with regular references from trusted and accepted MSM sources. You and most others, OTOH, just write whatever is in your small minds at the moment, rarely accompanied by any supporting articles. Your personal, uninformed and unsupported OPINIONS are worthless. 😛
Water system controllers don’t belong on the internet, says ex-NSA chief after suspected Iran attacks
https://www.theregister.com/security/2026/08/07/water-system-controllers-dont-belong-on-the-internet-says-ex-nsa-chief-after-suspected-iran-attacks/5285070
Probably true. There are too many systems and devices exposed to the internet. which leads to security problems.
For homeowners, anyone who brings devices into the home should check with AI for any known security exposures.
Biden’s illegal immigration surge screwed things up as much, or even more, than the Fed’s huge purchases of MBS. All our government data is permanently screwed up due to the illegal immigration fiasco.
So there was a surge of illegals and it only took two years to show up in employment statistics?
Go on, pull the other one since you are so gullible.
In spite of people who hate me on here, my comments are accurate. Where they have not been accurate, I have corrected myself within minutes. Sometimes it can take up to nine months for the news/data to reveal to the world at large that my comments are accurate, but nonetheless, they are.
PS Had the MBS purchases not been paired with the illegal immigration surge debacle, inflation would have been at least one percentage point lower than the peak, and possibly up to three percent lower. If you’ll recall, shelter was the main culprit of CPI inflation during that period, with illegal immigrants responsible for the majority of the surge in rents.
Minutes, eh?
How many minutes?
Mish let my post through, below, in spite of its length. I think it backs me up pretty well.
Rents surged where i live, and there is little illegal presence here.
Nine months is not almost two years.
But you have to be right – after all, you yourself say so!
Spoken like a true feral. You obviously didn’t even glance at the data.
PS Immigrant surges in some places, displace people who move and have to rent in other places. The data bears me out. There were roughly 45 million rental households, and that was paired with a surge of roughly eight million illegal immigrants, with a roughly 6% vacancy rate at the time they started coming in. Do the math.
Read the comment I shared below, containing many of the details surrounding the BLS data.
Neither employers nor illegal immigrants wanted to report on illegal immigrants associated with specific businesses. Business owners had incentive to not report accurately, and sometimes decided to not respond to surveys. Ditto for the illegal immigrants.
Net result? A low trust society, riddled with inaccurate data sources. Bad repoting on one business aspect just encourages corruption *throughout* business reporting activities, including financial.
It’s a snowball effect, where “encouraged” lying just begets more pervasive lying, and in greater volumes.
Here’s what “AI Slop” has to say, which seems to correlate remarkably with reality:
Yes, data discrepancies and statistical anomalies within Bureau of Labor Statistics (BLS) metrics correlated directly with the rapid surge in illegal and undocumented immigration between 2021 and 2024. [1, 2]
The primary statistical issue was not political manipulation, but rather a methodological lag. The BLS relies on population baselines derived from older Census Bureau models. When the immigration surge peaked in 2023 and early 2024, the government’s population data undercounted the actual number of people living in the U.S., which mathematically skewed monthly employment calculations. [1, 2, 3]
This demographic shift fueled specific statistical “discrepancies” across three main areas:
1. The Payroll vs. Household Survey Gap
The most glaring discrepancy during the 2021–2024 surge was the widening divergence between the BLS’s two major employment metrics: [1]
From late 2021 through the end of 2024, the payroll survey showed 3.6 million more jobs than the household survey. Independent economic analysis by the Federal Reserve Bank of New York and the Congressional Budget Office (CBO) confirmed that a large portion of this gap emerged because undocumented immigrants are highly unlikely to answer government phone surveys or door-knockers, causing the Household Survey to miss them entirely. [1, 2]
2. The Census Population Undercount
The BLS calibrates its monthly surveys using population controls provided by the Census Bureau. Because the immigration surge moved much faster than official Census projections, the government was working with outdated baseline numbers: [1, 2]
3. The Historic Re-weighting and Revisions
Because the underlying population estimates missed the sheer scale of the 2021–2024 immigration influx, the BLS had to issue massive retroactive corrections: [1, 2, 3]
Ultimately, the data shows that as the unauthorized influx escalated, the BLS’s real-time monthly reports became less precise, creating an optical illusion of a cooling labor market when the economy was actually expanding via uncounted worker inflows
All of this “unemployment” tracking is a distraction.
The one thing that is a real indicator is the number of fully employed 25-55 civilian men at bread-winner wages (as David Stockman often states),.as a proportion of the 18-65 year old population. This indicates whether ground is being gained or lost.
The rest of the data is all compromised, debatable, manipulated, massaged, historically compromised, etc. Some other stats address important corollary issues, but unemployment has become a pretty meaningless number since the 1970’s.
Stagflation…groovy BACK to the 70’s
I’m going to pin my ‘Whip-Inflation-Now’ button on. That’ll help.
I hear the army is hiring….
With a population a tenth of the US..
OTTAWA, Aug 7 (Reuters) – Canada’s economy added far more jobs in July than expected and the unemployment rate dropped to a two-year low, data showed on Friday, in another sign the economy is coping with U.S. tariffs and international tensions.
Statistics Canada said employment had jumped by 75,100 positions on strong gains in both the full-time and part-time sectors.
Different government. Doesn’t matter to the US what happens in Canada.
It’s all great, just listen to the experts…
Kevin Hassett on Fox News argues that if you exclude the sectors that lost hundreds of thousands of jobs, “you actually had a number that was about plus 100,000”
Why, that’s more than 15000%
A rare truth! Also true Steven W. Hawking could have been a fine MLB pitcher if you exclude all the runs he would have given up.
Everything that the BLS (Take out the “L”) is just that:
BS.
Is it possible to show a chart of deportations, remittances to people in foreign countries, and employment vs time to determine if/how much significance deported people played in the job market / economy.
no
We do not have such numbers
Trump is quickly fumigating the house!
He’s fumigating the Whitehouse with his flatulence and free range bowel movements.
The trousers bear the brunt of it, but what gets unleashed on those in his vicinity is still a biological weapon. There has been trauma. I have seen it in their faces as they abruptly end press events and shoo everyone away.
Little Marco has the 1000 yard stare now, and it’s from dozens, maybe hundreds of these events he’s endured.
90% confidence interval is about +/- 120K.
We have now reached the point where a $2+ Trillion federal deficit results in hardly any job creation at all.
Methinks the “can” can-not be kicked much further down the road.
Nonsense… bring on the Squillion!
Just wait until we start pumping out thousands of Patriot missiles. “Guns vs Butter” economy.
Another Trump fabrication when he says the economy is booming, better that it was in his first term. My fear is that we get even more reports indicating a severe downturn and the response from government and the fed will be to paper it over with money, an effort doomed to fail as we have experienced via much more deficit growth than GDP growth.
How Much Credit Growth Does It Take to Expand Real GDP? – MishTalk
You know what’s booming? Rheinmetal arms revenue.
Credit is the obverse of debt. Deficits, therefore, can be good, bad, or indifferent. Credit, properly used, is the “life blood” of a healthy economy. If the monies represented by the deficits are spent on projects which increase productivity and reduce waste, the deficits are beneficial no matter how financed. The initial inflationary effects of bank financing are quickly overcome by the larger output and lower unit costs.
Debt incurred which reduces unit costs of production and promotes the health and welfare of the population obviously is “good” debt.
Debt incurred to finance transfer payments (interest, pensions, etc.) is of dubious quality. Any enterprise, private or public, is in dire straits if it has borrowed in order to make such payments.
“… Debt incurred to finance transfer payments (interest, pensions, etc.) is of dubious quality. …”
We can’t generate new babies (actually, fully productive humans) rapidly to contribute value into such schemes. Might new robots be a different story?
Take a look at the Canadian jobs numbers in comparison> Seems like the tariff impact is hitting US more so than Canada
Who’d have thunk more expensive aluminum and electricity would sting?