
Home prices remain in the stratosphere, transactions in the gutter.
Case-Shiller Chart Notes
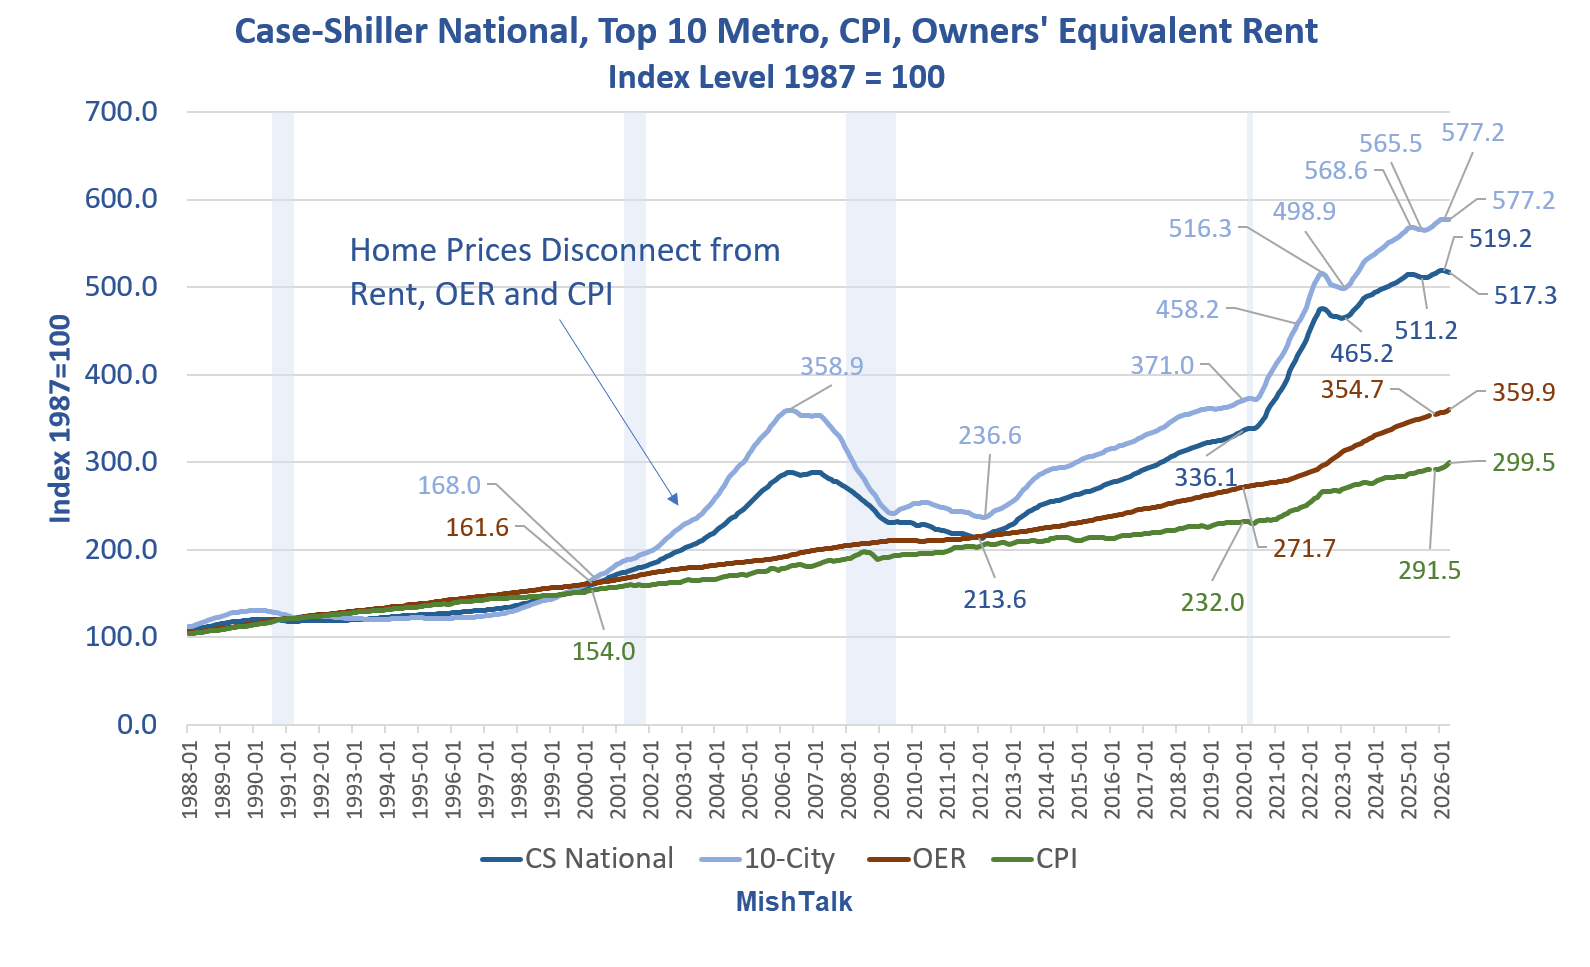
- CS National: Case Shiller National Home Price Index
- 10-City: Case Shiller 10-City Home Price Index
- CPI: Consumer Price Index
- OER: Owners’ Equivalent Rent, the price one would pay to rent their own home unfurnished without utilities
All of the above are seasonally adjusted.
National vs 10-City Index
- The national index is a record high 577.2 in April matching the February high. In May, the index dipped to 577.0.
- The 10-city index is 517.3 down from 519.2 in February.
Case-Shiller is is the best metric for price comparison because it measures the same price over time.
Median and average price statistics from the National Association Realtors, the Commerce Department, and others fail to capture location, number of rooms, amenities, lot size and other key measures.
The one drawback to Case-Shiller is time lag. The April report released on June 30 measures prices for February, March, and April.
That’s an effective lag of approximately three months. However, the lag is the price for accuracy.
Case Shiller Reports Annual Gain in April 2026
Please consider S&P Cotality Case-Shiller Index Reports Annual Gain in April 2026
“April’s figures confirm that U.S. home prices remain essentially flat, with the S&P Cotality Case-Shiller National Home Price Index up a scant 0.8% year over year, just above March’s 0.7% pace,” said Nicholas Godec, CFA, CAIA, CIPM, Head of Fixed Income Tradables & Commodities at S&P Dow Jones Indices. “With inflation accelerating to 3.8% in April, U.S. home values have now declined in real terms for an 11th straight month, further eroding inflation-adjusted housing wealth.
“Geographic dispersion remains pronounced,” Godec continued. “Midwest and Northeast markets are still leading moderate growth, while many Sun Belt and Western metros see ongoing declines. Chicago was again the strongest market with a 6.5% annual gain, trailed by New York (3.8%) and Cleveland (3.2%). Seattle’s 2.3% year-over-year drop was the steepest in April, with Denver (-1.8%), Tampa (-1.8%), Dallas (-1.6%), and Phoenix (-1.7%) also among the notable decliners. The nearly 9 percent performance spread between Chicago and Seattle highlights how localized housing trends remain.
“Monthly price movements show seasonal strength masking underlying softness,” Godec observed. “On a non-seasonally adjusted basis, the National Index rose 0.8% from March (with the 10-City and 20-City Composites up 1.1% and 1.0%, respectively), reflecting typical spring gains. Yet after seasonal adjustment, the National Index dipped 0.1%, while the 20-City Composite was essentially flat (-0.04%). The latest six months saw a 1.35% national increase, offsetting a -0.5% decline in the prior six months. This represents a modest shift in direction, but remains limited in the context of rising costs.
“The affordability pinch remains a key headwind,” Godec concluded. “After dipping below 6% earlier this year, 30-year mortgage rates climbed back to 6.3% in April, keeping financing costs elevated. In this higher-rate environment, home price growth remains constrained, with housing largely treading water in nominal terms and falling in real terms.”
St. Louis Fed Data Feed
The St. Louis Fed (Federal Reserve Economic Data – FRED) did not upload the city data, only the 10-city and the national indexes.
Here is the latest data that I have.
Case-Shiller Home Price Detail Percent Change Year-Over-Year

Year-Over-Year Percent Change
The 10-city and national averages are through April, specific cities through March.
The Chicago and New York metro areas are doing very well. Las Vegas, LA, and Miami are doing poorly.
Case-Shiller National, Top 10 Metro, Percent Change From Month Ago

That is stale, from March, due to missing update on FRED.
Long-Term Perspective

The above chart and the lead chart put the slowdown into proper perspective.
A 50 percent decline in home prices is needed before we can talk about affordability.
Between 1988 and 2000, home prices rose in sync with rent, OER, and the CPI.
A huge series of Fed mistakes, first by Bernanke, then repeated by Powell led to home prices soaring wildly.
Related Posts
January 30, 2026: Dear Zoomers, Trump Says He “Wants to Drive Up Housing Prices”
Somehow, I doubt Gen Z will like this message.
May 31, 2026: Housing Stagnation for Over Three Years in New and Existing Home Sales
New and existing-home sales collapsed in 2022 and have gone nowhere since.
June 16, 2026: Housing Starts Crash 15.4 Percent on Top of Steep Negative Revision
Compared to the unrevised April number, starts decline 19.7 percent.
June 25, 2026: New Home Sales Drop Another 7.3 Percent, Builders Struggle with Rising Inventory
Sales are down. Inventory is high and rising, pressuring builders.


I miss Calculated Risk, he was so good at analyzing housing. Mish is picking up the slack here. I doubt CR ever expected a racist construction labor crunch
Houses are labor intensive and cost of materials are up. This is what happens, supply gets constrained. People will need to just be happy with small, 3-bedroom houses again and say goodbye to McMansions. We will also have more people living in apartments and Condo’s, like in Europe. The climate alarmists wanted this, but the reality is that economics is what drives change, not mandates and regulations.
The average price in my neighborhood is 1.5 million. The latest house sold was a pocket listing at 2.6 million. It was bid up over ask. Last remodeled in the 1980s.
and what did I write on a previous thread regarding the seemingly daily corruption?
FIFA lifts US star striker Balogun’s red card suspension at World Cup after Trump calls Infantino
Life ain’t fair! 🤣
Now USA better win.
I just type in FRED MSPUS when I want to know the “real” house price situation. I know for a fact there are very large swaths of America where sellers cannot get anywhere near the “mid-2022” price for their homes.
It is The Greatest Fool’s time to shine.
“I pity the fool…”
He liked gold, but hated trees.
In just the past week, I have had several cold calls/texts inquiring about a property I own that I have no intention of selling. One of them was AI; I had some fun with that one.
My take is the brokers are so desperate for inventory to buy to flip, or rent that they’re resorting to the most disreputable tactics of telemarketers and medicare scammers.
Nah i prob get 15 texts/ calls/ letters a year. They go through the tax records looking for easy score. I figure sneaky russians.
I even get a call about some property i supposed own in freemont wy.
And this means the DSA is almost certainly going to be the new force in politics as zoomers rightly feel robbed by their elders. You want socialism? Charts like that are exactly how you get it. I’d agree with Texas Tim that this was a course correction if it weren’t for the fact that the older generations are very loudly living better than kids and are flaunting that wildly. That’s not a wise move.
I honestly could see socialists taking the USA by storm as the majority starts asking itself why 1% of the population owns most of the wealth. This isn’t capitalism, this is feudalism in a trenchcoat with nothing beneath. I’m not anything close to an economic socialist and even I think this needs to be reigned in majorly before people start talking about seizing the means of production.
This comment right here ^^^
When you allow monopoly power to run amok, crush moral hazard by backstopping bad loans and behavior, print money via debt from the future and pull it forward to enrich yourselves in the now, depressing interest rates for yourselves while knowing that long-term the bond vigilantes will not tolerate those rates in the inflation-created world…well my God the comeuppance is practically baked into the cake. And the form of that comeuppance will be uncontrollable if the enriched aggregate refuse to give back their outsized passive gains they’ve received in the last 17 years since the insane reaction by the government and Fed post GFC and then again in spaces post covid.
I will despise and vote against the clowns that are winning primaries in deep blue districts like NY and CO, which will allow radicalism to take their districts further left; however, I won’t quesiton the why. Anger spills out into fitful poor-impulse-control ways. So to all that have seen 15-16% annualized returns for the last 17 straight years and a doubling or more of home prices since like 2022, well, there will be a price let’s just hope it won’t be our collective heads. How’s about some willingness to see the insanity and accept lower prices. Of course my comment is always, “starting with you” (or someone not named “me”)…and that’s why it won’t start organically but will be forced in ways we least expect or prepare for.
As I say when I see real estate prices…good luck.
As I understand it, the biggest problem with housing is local zoning laws and suchlike, that force housing to be fancier than people can really afford. In New South Wales, a state of Australia, the State Government recently took regulation of housing out of the hands of local government, I believe. That should help to relieve the problem. Of course, those developers who have been building the big, fancy houses won’t like it.
Let’s hope the Democratic Socialists are not going to be the new force in politics, because that means something as stultifying as the Soviet Union in the long run. I hope that some of the votes for this group are really anti-Israel votes. I can understand sympathy for the Palestinians, and would have been tempted to vote for a Moslem myself. That said, I would still ban Moslems from immigrating to the civilized world, and would be asking myself what needed to be done about the Jewish influence, too.
The socialism of the post-war period seems to have worked out in such a way as to benefit the baby boomers. You must remember that simple saving is bound to result in much greater wealth for the older generation as against the younger generation.
Looking forward to your Epstein allegations in reply.
Allegations? Arthur, who called them “little hookers?” Would you like me to link your words?
https://mishtalk.com/economics/does-president-trump-have-any-idea-what-passports-are-for/#comment-449328
Oh? What’s that? There you are! I have it saved too in case you feel like deleting it.
bernie would be a moderate in all other developed countries the us is just way behind. Democratic socialist will at least be for the people by the people I was a card carrying repub for decades but the inequality is way out of hand a few hundred should not own most of the assets. and the rise of the democratic socialist will be trumps greatest feat
The younger generation *always feels robbed by their elders*. The boomer hippies felt it and raged against it in the 60s during the flower power / free love era (just listen to that music).
Except those hippies turned into the boomers of today who you now say are living large. Well eventually those hippies got older, inherited and/or got into better job positions and accumulated wealth. And interestingly enough, once they accumulated wealth they too didn’t want to give it away any more than their parents did despite claiming otherwise when they were hippies.
The next transfer of wealth is beginning now from boomers to Gen X and Millennials. In the next 20 years those generations will have the wealth the boomers now do. My guess is they won’t be giving it away any more than their hippy parents did so the DSA stuff will be short lived (as in until they inherit or get into better paying jobs).
Nooo! While your comment about elders may be directionally correct, this time was absolutely galactic in scale and particularly acute in terms of disparity. FORTY years of ever-declining interest rates was an INCREDIBLE tailwind that Boomers got but pretty much no generation before enjoyed (and even if they did, it was in an age before leverage was as powerful of an asset-multiplying mechanism). Add to that the Boomer’s unwillingness to ever experience a drop of austerity and opting instead to use the money printer to solve every current “problem” (at the expense of future generations) and it is unequivocal that no generation has ever screwed over the subsequent generations as badly as the Boomers have. Let’s also keep in mind that other generations traditionally entered their golden years quietly and modestly, disappearing to a small condo in Florida. While that still happens, a huge number of Boomers are “aging in place” like never before and actively participating in all the various speculative/ponzi schemes that we can see around us. Boomers don’t believe in sunsets, they want a mushroom cloud or nothing.
I think caveman responds to this well, but I’d like to add that the greatest generation did not pull up the ladder behind them like Boomers have. Boomers moved the jobs away instead of building anything here. Boomers voted in Reaganomics and gutted the framework that made the nation great. It’ll honestly take an FDR situation at best to undo any of this damage with how deep it’s gotten.
In fairness, I think most people did not understand the deal with the devil Reagan was making, probably not even Reagan himself. Reagan let the Wall Street goons brainwash him.
People hate to hear it (hence the downvotes) but Reagan was kind of a moron and it shows. Boomers love him as the free money man, but his domestic policy was toxic (see AIDS) and his economic policy was pants on head retardation candy-coated with gobs of cash handed out to anyone on two legs who owned a business.
People can downvote all they want but the piper clearly wants his payment.
Do you chaps think history started with Reagan? It was FDR who first institutionalized bad economics. I was a big fan of Reagan before he was elected, and didn’t understand what he was doing in economic strategy once he was in power, but he forthrightly confronted the Soviet Union, for which I forgave him a lot. David Stockman, who was as I recall it a very young Secretary of the Treasury under Reagan and who is still writing, sometimes throws some light on what Reagan’s administration did.
I think it needs someone to confront bad economics in the way that Reagan confronted the Communists, to rectify what is wrong. But you must remember that it won’t be easy, whoever does it. Ludwig von Mises famously said something along the lines of: “There is no way of avoiding the crisis at the end of a period of inflation. The choice is between stopping it voluntarily or waiting for the final collapse (after which it will presumably correct itself, with a completely new political system, or even a new race, in charge).” Von Mises was of course writing with the experience of the collapse of the Austrian economy in his mind. The experience of France after 1870, and that of Germany during the American occupation, may not have been quite so bad.
As Americans, you should be able to read up on the collapse of your Continental dollar, also.
In blaming the baby boomers as a whole for what was done, you are casting a wide net. Most people did not understand what was being done by their rulers. I blame the people who were in a position to understand and who did understand, but who went ahead and created a socialistic, inflationary system anyway. And that began with the failure to restore convertibility of paper money to gold at the end of World War One. Very few baby boomers understood economics, and very few of the generation before them did either. The subject was systematically obfuscated.
Wolf runs his monthly snapshot of the various major markets in the US. Many are already down 20 plus percent (especially in the condo markets) so those aren’t likely to fall another 50%.
It also doesn’t seem possible that homes will fall 50% from where they are. The built in floor is land cost + construction cost (including building codes for that location). In many cases that floor is way above 50% of the current market price which would mean new construction would be impossible if prices fell 50%.
Instead I suspect we’ll go back to the way things were in the 1930s and earlier where multiple generations live under one roof. That’s actually quite common in the rest of the world and was common in America in the 1930s and earlier (esp on farms which was a big chunk of the population). What happened in America in the 50s through early 00s was likely the aberration rather than the norm and so America is moving back to the norm.
What propaganda this is. Things change i. History and this argument of of the establishment just protects the rich and avoids philosophical and scientific inquiry. The distribution of wealth can change based on rules and the rules currently make it so the middle class will cease to exist.
Is eliminating slavery an aberration? Of course not, its the rules. If americ makes it illegal to be black, those are our rules, not an abberation.
Interestingly enough, the the middle class is something that also didn’t really exist before the 1930s either. It’s a mid 20th century phenomenon that may also be an aberration.
Anyway you don’t need to own a home to be middle class or even rich. Plenty of very well off people in big cities never own any property in their entire lives (much of NY City are renters and yet they are also upper middle class).
Until the AI and its robot workers makes everything free to all, including houses. Only 20 years or so away!
The Typical Home Will Cost a Million Dollars as Millennials Hit Retirement, Economist Says
https://www.realtor.com/news/trends/home-prices-forecast-nar-lawrence-yun-2026/
Nominal price is meaningless, price to income(s) is all that maters in my view.
Based on the history of trashing Illinois, and Chicago specifically, I’d love an explanation for that market’s outsized gains. As for the overall picture, my 2.99% mortgage yawns.
“Metro area” = “that market”, same as in Wolf Richter posts. Counts city proper and burbs. In Chicago metro, that is Crook and “the collar counties”, Lake(IL), DuPage, Will, Kane and McHenry.
Kenilwortb burb
Lake Forest burb
Winnetka burb
Hinsdale burb
Burr Ridge burb
Naperville is sprawling into 3 different counties
People wth money from the citiy have been moving out that way starting just about May 2020 for some reason “to get a nice backyard for the kids.”
.
.
.Chicago city –
Lincoln Park : Gold Coast
Streeterville
Hey Jack@ss parts –
Austin neighborhood
Englewood neighborhood
Garfield Park neighborhood
Little Village (Lawndale) neighborhood
Aging hipster parts-
Wicker Park
Logan Square
Wrigleyville
Old Town
The south/southwest side of Chicago / south/ southwest suburbs have their own lore. “They’ll never cross Western Ave!” Battle Cry in Gage Park, Marquette Park, Mount Greenwood neighborhoods circa ~ 1966.
M- lived way northwest in horse country Marengo, a shorter drive to Wisconsin state line than the city limits of Chicago..
Those that have to sell will need to cut their asking price. Those sellers hoping to get top-dollar will have to stay put until they realize that the market has shifted to the downside.
That being said, you should check out this house in Key Biscayne, FL with an asking price of $237,000,000. It is situated on the grounds of the former Nixon winter White House. That structure was torn down to build a more modern house. It was Tony Montana’s house in the movie ‘Scarface’. I wonder what it will eventually sell for.
485 W Matheson Dr, Key Biscayne, FL 33149 | MLS #A12005335 | Zillow
Probably very close to asking. People who buy those kinds of homes aren’t struggling with prices.
Down in my fair city of Denver.
Especially when adjusted for inflation.
https://www.3968vrain.com/English/Denver/CaseShiller_Prices.html
I never got how Denver was so desirable… it’s basically Kansas with mountains in the distance.
Affordability is mainly determined by the monthly payment.
Interest rates determine housing prices, much in the same way as bond prices.
At 10% prime rates, housing prices would be crushed.
A 50% decline in home prices would cause rioting across the country!
As well as unbridled joy among the young.
Not really because they would all become unemployed.
Confirmed! Illegal immigration did contribute to increases in rents and home prices.
So junk data that doesn’t fit together being hot glued to sell a narrative. Got it!
Come on Creamer, the Fed is always right about everything, just look at the past 50 years! /s
Rule #1 of the internet: Data or source always bad when reader doesn’t like conclusion(s). 🤣
The #1 rule here is if JoJo posts a comment, 99% probability it’s wrong. Don’t make me pull up all your past incorrect predictions JoJo, don’t make me do it.
Do it. You apparently have nothing better to do with your time except talk smack about one day granting us all relief by exciting somewhere that hopefully doesn’t have reliable internet service.
The source isn’t the problem, it’s mashing together two sources to come to a nonsense conclusion.
Fixed it up a bit. Welcome to Trump’s turd economy. You reap what you sow but it ain’t over yet. There are 930 more days of poop to travel through the economic digestive system before this turd gets flushed.
Do worry, Trump, Walrus and the GOP will find a way to make things even worse.™
…and replaced with what exactly that will fix this? Your beloved turtles were running (do they run?) amok during the Biden Administration too.
However I did appreciate your strikethrough on Home, that was masterclass editing! So damn true.
The way things are going, it’s going to be socialists running things or Nazis, either way, I’m out.
Thinking of the same but my financials aren’t there. Where to go? Probably asia…..
Mish, thanks for this summary. You need a day off, Right? You are putting in a lot of time here.