

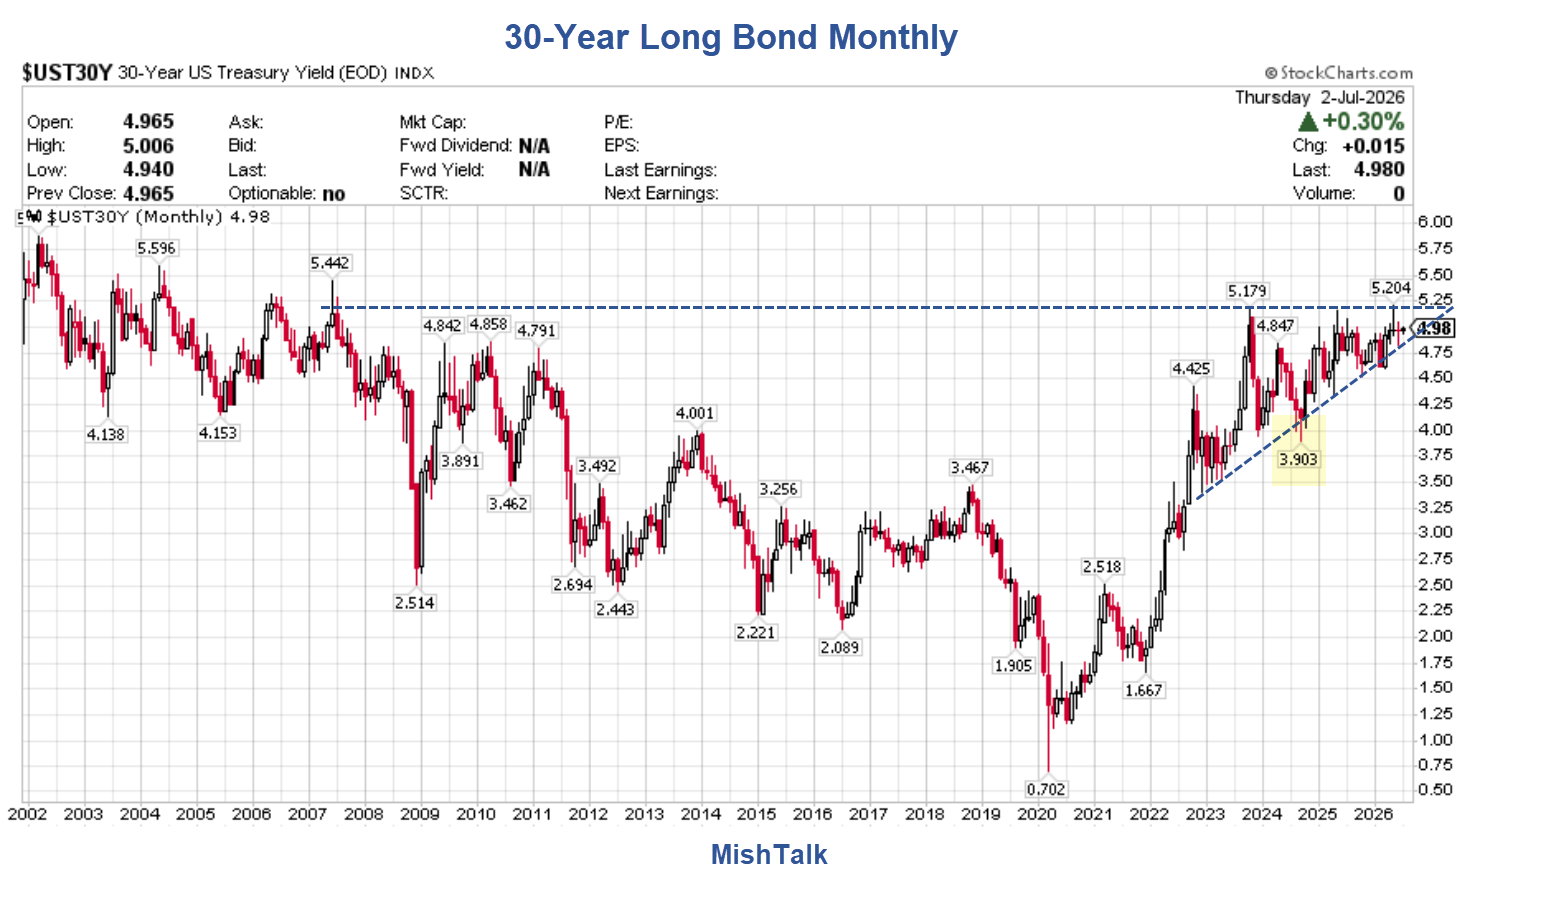
The 30-Year Long Bond Yield Is Still Hiding Its Breakout Direction Intent.
Those who though falling oil prices would relieve bond market pressures have been wrong so far.
$WTIC vs Long Bond Weekly

The long bond yield has generally headed the opposite direction since late 2023.
Big oil price gyrations did correlate briefly with bond market moves, but that stopped.
$WTIC vs Long Bond Daily

Between March 2026 and mid-June, the long bond yield and the price of oil had a positive correlation.
However that ended about June 22 with long-bond yields blasting higher.
As I type, the long bond yield is 4.99 percent up nearly 20 basis pints from the low.
Technically Speaking
Technically speaking, the monthly chart is in an ascending triangle pattern whose expected next move is higher.
The apex of the triangle is roughly 4.20 percent. There’s little room left in the triangle before decision time.
Fundamentally Speaking
- Rising debt
- Rising deficit (Trump wants more money for military spending)
- Falling oil price
- Expected moves lower in year-over-year CPI and PCE
- Some tariffs have played out but others haven’t
- USMCA uncertainty
- Renewed chance of Mideast war
- Jobs are more than a bit anemic, yet have not collapsed.
- Very stretched stock market valuations
- Price of rent appears to have bottomed and heading higher.
- Fed Chair Kevin Warsh wants to reduce QE liquidity but has instead proposed studying the matter.
The technical picture is clear, but unresolved.
The fundamental picture is as clear as mud. I do not know how to evaluate that and no one else does either.
Yet …
Knowing the Unknowable
Thorne could be right, perhaps even for the wrong reason.
By that I mean Thorne appears to be a staunch Trump supporter and he sure isn’t hinting at recession.
The difference between Thorne’s position and mine is that I know there are things that I don’t know.
Here’s another clue.
CME Fedwatch Odds

CME Fedwatch Odds December 2026 as of 2026-07-05
- Rate Cut: 0.00 percent
- Stand Pat: 23.2 percent
- At Least One Hike: 77.8 percent
- Two or More Hikes: 34.9 percent
I see no reason to argue with that. But that does not mean it’s correct. If I have a reason to think otherwise, I am willing to say so, but what reason is there?
October is a different matter on which I do have an opinion.
CME Fedwatch Odds October 2026 as of 2026-07-05
- Rate Cut: 0.00 percent
- Stand Pat: 36.2 percent
- At Least One Hike: 63.8 percent
- Two or More Hikes: 18.3 percent
The Fed is going to be loathe to hike twice right before an election. And it will be very concerned about a hike on the October 26 meeting unless there is a raging inflation inferno.
There is no meeting in August, so the best shot for a hike is September or July. For September, there is a 53 percent chance of at least one hike. Two by September would imply hikes in July (21.9 percent chance) and September.
Odds of a Rate Hike Before the Election
- The market odds are 63.8 percent of at least one hike. That may be slightly high if one discounts October. September is close to a coin flip.
- The technical expectation is clear (but it could be wrong). The fundamental picture is a mixed brew of mud.
- Practically speaking, neither the bond market nor the futures markets expect the next move is a rate cut, why should I?
Since nothing else is convincing, I believe the betting odds that the next move is up. If not, the most likely reason will be major job or economic weakness as opposed to everything coming up roses.
In this view, the CPI, PCE and job reports in July, August, and September will determine the outcome at the September 16 meeting, with the Fed on hold in October.
Related Posts
July 2, 2026: Economy Adds Only 57,000 Jobs in June, Huge Negative Revisions
Employment dropped by 507,000. The unemployment rate fell because the labor force plunged by 720,000.
Leisure and Hospitality is no longer adding jobs according to two reports. That’s a significant change.
July 3, 2026: The Alarming Trend of Health Care Job Creation and Why It’s Bad
Health Care & Social Assistance Accounts for a Majority of US Job Creation for Three Straight Years.
July 5, 2026: Case-Shiller National Home Price Index Hovers Near All-Time Highs
Home prices remain in the stratosphere, transactions in the gutter.
June 25, 2026: PCE Year-Over-Year Inflation Up 4.1 Percent, Fed Over Target 63 Straight Months
The Fed’s target is 2.0 percent, actual is 4.1 percent, up 0.4 percent from last month.






























Yes, both.
No time period specified.
This isn’t rocket science.
If you look purely at the economy rates should be heading down. The inflation we are experiencing is mostly transitory and there is the flight to safety factor that will also drive it down as well an economy that is really hurting.
I think any upward movement in rates relates to US government bonds. There is simply too much government debt and the market may be having trouble soaking up the supply especially when faith in government is what it is. We are going to have at least two more years of this clown car with no driver. Best case is 4 months to mid-terms and then 18 months to impeachment and even then does anyone have much faith in the economic decisions made by democrats? They will raise taxes and spending to be sure. Better than Trump but still not exactly a comforting scenario.
@Mish you said 4.2 as apex. I assume you mean 5.2%? Looking at the chart triangle
The 30Y Treasury yield will likely hug 5% +/- 15bps through the end of the year. What the EFFR does is anyone’s guess. There are a handful of potential black swans in the background, so it feels like watching a juggling act.
Rates have risen because the FED has tightened.
Link the late: Daniel L. Thornton, Vice President and Economic Adviser: Research Division, Federal Reserve Bank of St. Louis, Working Paper Series:
“Monetary Policy: Why Money Matters and Interest Rates Don’t”
Thornton: “the interest rate is the price of credit, not the price of money”
“Today “monetary policy” should be more aptly named “interest rate policy” because policymakers pay virtually no attention to money.”
I predict that it will be one of the two.
The macro technical for the long bond remains the previous 54 month cycle bottomed at 3.9% in 2024. Since then the first of three 18 month cycles bottomed at 4.625% in March 2026 of the present 54 month cycle. The present 54 month cycle amplitude looks very weak compared to the previous cycle. The present 54 month cycle is still above the previous cycle lower trend line, but is in danger of going below the trendline by pushing sideways. Should the yield break the supporting trendline, chances are very good the third 18 month cycle will end much lower than the start of the present one.
There is an e-wave count that supports the above cycle count: Zigzag from the 2020 lows.
Wave A ended in October 2023.
Wave B ended September 2024.
Wave C is a possible ending diagonal in wave 4. wave 5 is likely to complete after the 2026 elections.
The second 18 month cycle and wave 5 will top at the same time. Sharp reversals typically follow ending diagonals, which happens going into a cycle low.
Given the top for this 18 month cycle is after the elections, the Fed will feel safe raising rates in July or September.
not a shot in hell is fed raising rates in the next 4 months, due to elections. easy call.
Unless Democrat is President.
You say some of the Tariffs have “played out”. what do you mean by that? do you mean that the person who came up with this tariff scheme (because Trump is too stupid and chaotic to focus on such a thing) was successful in some cases?
what are these successes? I want to know
Tariff refunds in the process
Trump replaced those with other dubious tariffs
Importantly Trump raised tariffs on steel an aluminum, those price hikes not yet passed on
“The Dow is over 50,000 right now”
price those 50,000 currency units, in homes, gold, groceries, insurance, taxes, tuition……….
The one-year return on DIA, a DOW ETF, is 19.59%, far, far above inflation, and out-performing your home, which has substantial costs associated with it, Chicken Little. The ETF is also very liquid, just requiring a keystroke trade execution, unlike physical gold.
The US is in banana republic financial condition, with a corrupt congress and managed by a wannabe dictator. The Fed will do whatever it takes to keep the music playing, with hubristic belief that they can fix things long term. Evaluating rate direction on fundamentals is misguided, imho
In other words i doubt the fed can be independent and raise rates, that ship has sailed. Not only because of Trump, but also Congress and the bread and circuses needed by the voters.
I think that “At Least One Hike” should be 76.8 percent
They say ,’Follow the money.’
In this case follow the Money Supply, M2 and M3, the expansion from 2025.That should give you a lead.
Oil market is a strange creature. Oil levels in oil storage tanks around the world are decreasing and oil price is going down. A wierd paradox no one is able or willing to explain.
Oil is just one part of the whole story. What about sulphur and fertilizers and food price? Aluminium?
Reminds me of an earlier urban legend spoken of: a “plunge protection team” for stocks. So maybe a ghost “spike prevention team” now for oil? A [you name it] protection team pre-midterms? I have no respectable track record on anything that touches on oil!
Normalcy bias coupled with Iran’s stunning victory in the war now opens Irans spigots causing a future oil glut. More than anything else, markets reflect the human biases of naturally optimistic traders.
If we had a robust economy, oil prices would be surging. Trump GDP flat-out sucks, and he’s cheating as hard as he can.
Interest rates go up until the economy craters.
Trump’s history is to exercise no strategic patience, and accordingly, to grab any and every lever in sight, and squeeze any proximate balls, to keep the headline numbers up. He is an extreme example of the new flashy Boeing aircraft and big breast man. It’s all headlights for him, and apparently his fans.
Trump will love higher rates before the election. More fuel to add to the communist takeover talk and whatever he can declare to cheat the election.
Retired people needing healthcare but not needing a job is part of keeping the unemployment low.
Boomers are leaving the workforce in droves.
Yup they still want to use their retirement plans for not only medical but also goods and services.
Think we will find out those receiving government assistance ( the assistance part) contributes a lot to the economy. Which the government gets back in taxes down the road.
Government spending that is not dynamic disruptive creative destruction is a stabilizer to keep the churn from tipping the whole thing into social disorder. One might say that of the welfare state or [fairly static] warfare state or whatever. Even a 73-year-old with a car can cause a lot of entropy.
All money ends up in corporate hands through product sales or the financial system in bank accounts or investments. Figuring out how to creatively tax those things to recoup the money pumped into the economy through government assistance would be beneficial to reducing the deficit. Income taxes on individuals isn’t cutting it. It’s too easy for voters to vote themselves a tax cut in exchange for higher debt for everyone else.
Boomers were born between 1946 and 1964. So now they are between 62 and 80. So the vast majority are long since retired. What’s left is a slightly smaller cohort that represen birth rates that had already begun declining.
The Federal government borrowed roughly half the money it spent in the most recent month reported. Bibi’s stupid war is exploding spending and borrowing. I suspect this isn’t a negligible factor; it makes me lean towards interest rates drifting up.
Even as the Fed has created 235 billion $s ex nihilo since November (Monetary Base), to pretend that the country has $235 billion more savings to lend than we thought. Yeah, they can’t create savings, but they can steal some of the value of real savings and create the illusion.
They don’t have $235B to lend. Lenders believe there is $235B in future labor that can be pledged.