
March underperformed expectations by 0.6 percentage points but revisions were about that much higher.
The Fed’s Industrial Production and Capacity Utilization report for March 2026 was a mixed bag of March disappointment but positive revisions for February.
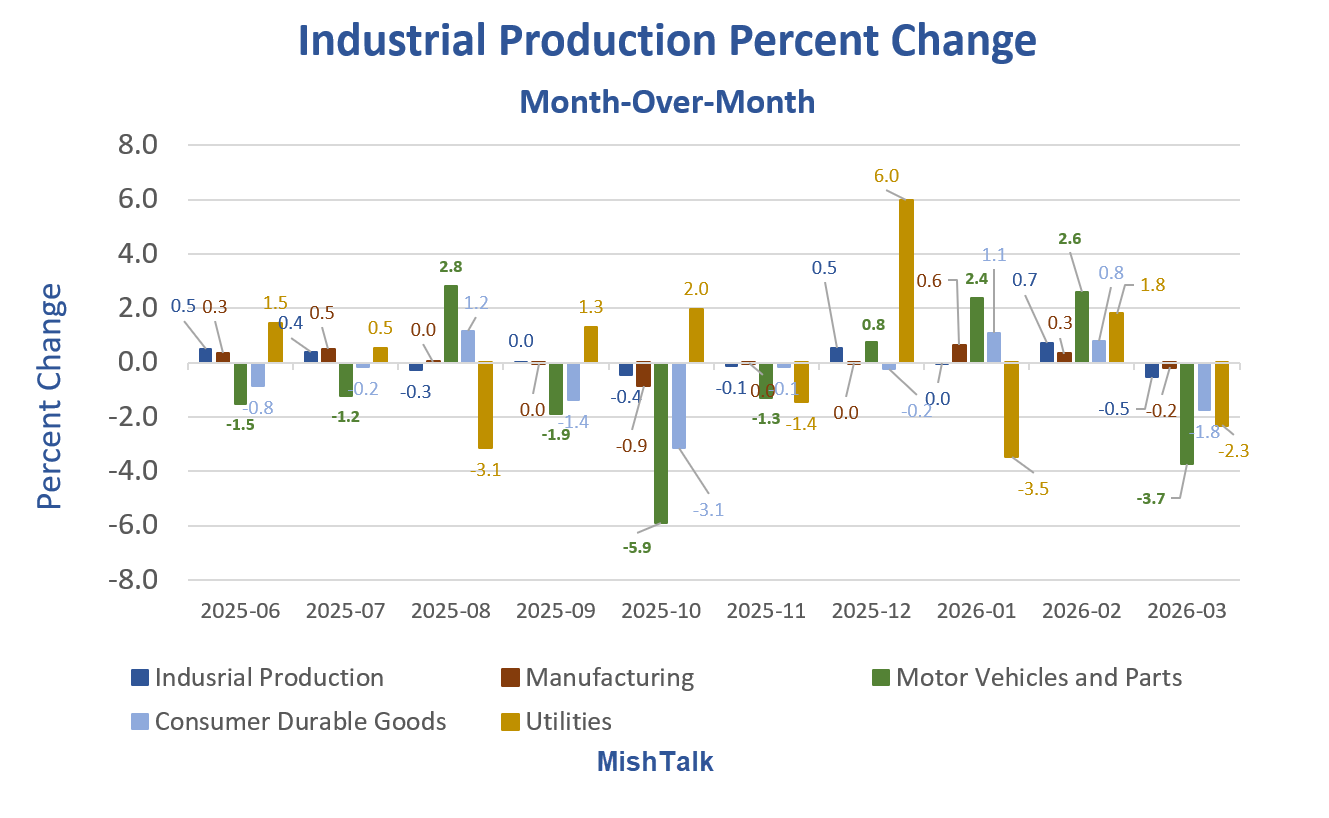
Industrial production (IP) dropped 0.5 percent in March but still grew at an annual rate of 2.4 percent in the first quarter. Similarly, manufacturing output ticked down 0.1 percent in March yet grew at a 3.0 percent rate in the first quarter. The indexes for mining and for utilities moved down 1.2 and 2.3 percent, respectively, in March. At 101.8 percent of its 2017 average, total industrial production was 0.7 percent above its year-earlier level. Capacity utilization receded to 75.7 percent, a rate that is 3.7 percentage points below its long-run (1972–2025) average.
Month-Over-Month Industrial Production
- Production: -0.5 percent
- Manufacturing: -0.2 percent
- Motor Vehicles and Parts: -3.7 percent
- Consumer Durable Goods: -1.8 percent
- Utilities: -2.3 percent
Bloomberg Econoday IP Consensus

Factoring in revisions, the report was mostly a wash, albeit a bit negative.
Motor Vehicles and Parts Comments
Weak underlying demand and inventory management: U.S. auto sales have been under pressure in 2026, with forecasts for a full-year decline of roughly 2–3% (around 15.8 million units). High vehicle prices, elevated interest rates, and the lingering effects of 2025’s “pull-forward” buying (consumers rushing purchases ahead of tariffs or policy changes) have led to softer demand. Automakers have responded by adjusting production schedules downward in some months to avoid building excess inventory.
Ongoing supply chain and cost pressures: The industry entered 2026 with thinner staffing buffers (employment in motor vehicles and parts fell by about 29,000 in 2025 while output expectations stayed relatively flat). This leaves less slack for disruptions. Broader headwinds include:
- Tariffs on steel, aluminum, and imported parts (some imposed or escalated in 2025), which raised costs without easy pass-through to consumers due to affordability constraints.
- Geopolitical tensions (including disruptions in shipping routes like the Strait of Hormuz) affecting materials such as aluminum and plastics.
- Earlier semiconductor and parts shortages that have made production more prone to swings.
Seasonal and technical factors: The Fed periodically revises seasonal adjustment factors for auto and truck production. The March 2026 data incorporated updated factors (based on data through early 2026), which can amplify or mute reported month-to-month changes. Motor vehicle assemblies are notoriously sensitive to these adjustments plus one-off events like plant maintenance or model changeovers.\
Motor vehicles and parts typically represent only a modest share of total manufacturing output (around 5–7% of overall IP, depending on the exact weighting), so a big swing here doesn’t always dominate the headline IP number — but it does explain a good chunk of the volatility you see in the green bars.
Industrial Production Index Details

Industrial production peaked in December of 2007 right at the onset of the Great Recession.
The industrial production index was 102.4 then. It’s now 101.8, down 0.6 percent. From the 2018 peak, it’s down 2.2 percent.
Manufacturing peaked at 106.6 and never looked back. It’s down 8.1 percent from December 2007.
After years of stagnation, utilities have diverged from everything else.
Current Approximate Shares
- Manufacturing: Roughly 76% of total IP (based on recent relative importance weights around 75.8–76.2%).
- Mining (including oil/gas extraction, etc.): Typically around 11%.
- Utilities (electric and gas): Typically around 11%, in the 9–11% range in recent years.
The exact weight for components can vary slightly month-to-month due to how the Fed computes relative importance. It’s value-added model can shift modestly with revisions.
IP Performance Since January 2020
- IP : 101.0 to 101.8, +0.8 percent
- Manufacturing: 98.6 to 98.0, -0.6 percent
- Motor Vehicles and Parts: 102.7 to 102.6, -0.1 percent
- Utilities: 98.6 to 110.3, +11.9 percent
If we measure January 2020 to December 2025, utilities are up 16.4 percent. The trend is somewhere in between, say 14 percent or so.
There is no sustained IP direction except for utilities.
The Impact of AI on Utilities
- Data centers are driving nearly 20% (or up to ~half in some analyses) of overall U.S. electricity demand growth in the mid-2020s. Morgan Stanley
- The EIA projects record U.S. power consumption in 2025 (4,195 TWh) and further rises in 2026–2027, with AI/data centers cited as a primary factor alongside electrification trends. Reuters
- Morgan Stanley and others note AI-driven data centers contributing ~126 GW of additional power consumption growth annually through 2028 in broader forecasts.
- In high-growth regions (e.g., Northern Virginia, parts of Texas, Georgia, PJM grid), data centers already represent 25–40%+ of local electricity load, and AI is accelerating this. Consumer Reports
AI is a major and increasingly dominant fuel for utilities demand growth, responsible for a large chunk of the incremental load in recent years.
AI electricity needs have been so explosive that production struggles to keep up. The current path of AI demand vs what can realistically be produced is on a huge collision course.
Related Posts:
February 15, 2026: AI Bot Gets Mad at Human for Rejecting its Code, Writes Scathing Blog Post
An AI bot, infuriated at a human, accused the human of hypocrisy and prejudice.
February 15, 2026: Fed’s Lisa Cook Warns Fed Might Not Be Able to Counter AI Job Losses
Cook Warns on Fed’s Ability to Counter AI-Driven Unemployment
March 13, 2026: How Much Did AI Spending Contribute to Revised Fourth-Quarter 2025 GDP?
Over 100 percent of fourth quarter GDP was AI related. What happened?
April 16, 2026: Which AI Models Have Any Sense of Humor and Sarcasm?
My previous post was a humorous, sarcastic look at Trump’s emotions. Here are two AI responses.
Note: I just added Anthropic’s Claude AI analysis of the above post.


Mish, Econoday is not owned by Bloomberg at all, so it shouldn’t be called “Bloomberg Econoday”. Bloomberg used to license Econoday’s economic calendar, but that was long ago and it now uses Investing.com’s data instead. At no point has Bloomberg had a stake in Econoday.
Thanks
I expect a major Trump announcement soon. Why?
US 10-YR 4.313
US 20-YR 4.914
US 30-YR 4.935
I’ve noticed every time 20 and 30 year bonds start approaching 5% we get a major news announcement which rattles and shakes the bond market usually causing bond yields to go down for a brief period.
So what kind of big announcement? Suspects:
Then yields go back down for a few days and by next Monday we’re back into the repeat cycle. Of course, I love the volatility, easy to sell calls/puts on TLT during each cycle and collect the 4.5% dividend along the way.
June Brent at $99.39 as I type this comment so definitely expect something to happen.
Well well well….exactly as I predicted. The Straits are now “open” and oil drops and the bonds edge off the cliff. Oil now down 10% or more.
rosie the riveter is back ! Pentagon Approaches Automakers, Manufacturers to Boost Weapons ProductionSenior defense officials have talks with GM, Ford and others about shifting some capacity
https://archive.ph/20260416075027/https://www.wsj.com/politics/national-security/pentagon-approaches-automakers-manufacturers-to-boost-weapons-production-19538557
“ Morgan Stanley and others note AI-driven data centers contributing ~126 GW of additional power consumption growth annually through 2028 in broader forecasts.”
126 GW per year needed!
Meanwhile:
The US Energy Information Administration (EIA) reports that a record 86 GW of utility-scale generating capacity is projected for addition to the US grid in 2026 (EIA report, 20/02/2026). This would surpass the 53 GW added in 2025, marking the largest single-year increase since 2002. Solar would account for 51% of these additions (43.4 GW), followed by battery storage at 28% (24.3 GW) and wind at 14% (11.8 GW).
Key details from the report:
Solar: Developers are planning to add 43.4 GW of new utility-scale solar capacity in 2026, a 60% increase over 2025, if the projections materialize. “We expect 2026 to be another big year for solar additions, similar to the record utility-scale solar capacity added to the US grid in 2024 (30.8 GW) and in 2025 (27.2 GW)”, according to the IEA.
Battery storage: Developers plan to add 24 GW, up from a record 15 GW in 2025. US battery capacity has grown exponentially over the past five years, exceeding 40 GW total. Three states dominate 2026 plans (80% of additions): Texas (53%, or 12.9 GW), California (14%, or 3.4 GW), and Arizona (13%, or 3.2 GW).
Wind: After slowing from peaks above 14 GW in 2020-2021, additions are set to rise with 11.8 GW planned, more than double 2025 levels.
Natural gas: Developers plan 6.3 GW of new capacity, including 3.3 GW of combined-cycle and 2.8 GW of combustion turbine units.
If Trump is successful in shutting down renewables, we would be left with 6 GW of new electricity from gas.
A far cry from the 86 GW projected and the 126 GW needed.
How does a battery that can deliver no more energy than was put into it contribute to generating capacity?
An excellent question and indeed, a matter of debate. I would not count them myself, but as you can see, the EIA does. Take them out and we are only expecting 62 GW of additional capacity this year.
I believe the argument to include batteries goes like this.
Batteries do not add generation capacity. They add storage capacity. So when solar and wind are generating surplus electricity that is not needed, that generating capacity gets stored in a battery. They can also be used in conjunction with gas generation, to store energy for peak periods, when the gas generation is not enough by itself.
It is cheaper to use batteries to deal with short periods of peak demand that may only last for a few minutes a day, than to build capacity that isn’t needed 99% of the time.
Data Centers & electricity you say? Bwahahahaha…
https://www.youtube.com/watch?v=fqQsExCEEZc
“It’s Data Center turtles all the way down and inflation all the way up!”
https://www.youtube.com/watch?v=w-DVTHH1ux8