

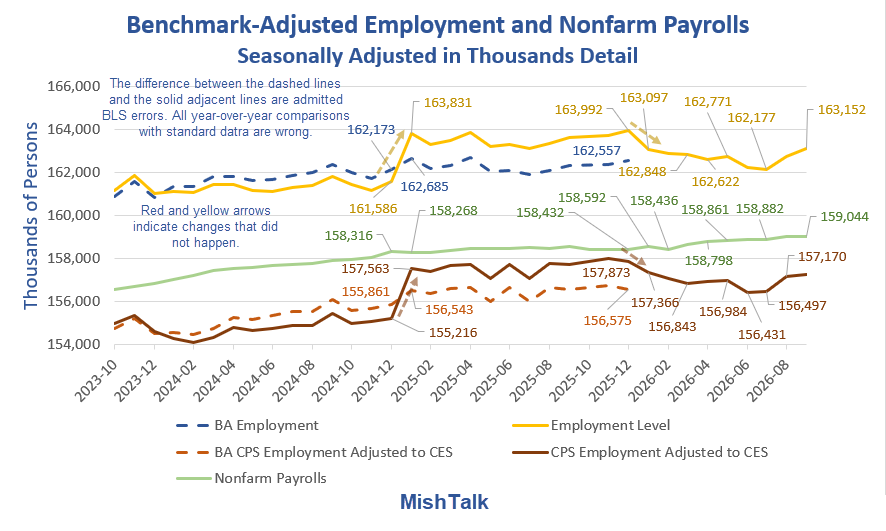
Nonfarm payrolls rose by 29,000 and unemployment ticked u to 4.2 percent.
Understanding the Lead Chart
Note: If you have seen this explanation, please skip to down to the subtitle “Initial Thoughts” to continue reading.
Every January (typically), the BLS has annual revisions to nonfarm payrolls and household population employment. The BLS does not back revise the household charts.
Because the BLS does not back revise, we see ridiculous numbers such as employment rising by over 2 million in a month (first yellow arrow).
To correct for the population adjustments, the BLS provides an adjustment series to normalize employment levels to match nonfarm payrolls. The BLS calls this “experimental” data but the regular posted data is admitted nonsense.
The experimental series is LNS16000000, “Employment Adjusted to CES Concepts“.
For 2024, the BLS admits that it undercounted employment by 2 million. Instead of parsing that out in the correct months, the BLS plowed the entire adjustment into January of 2025.
For 2025, the BLS admits that it overcounted employment by 1.4 million. Instead of parsing that out in the correct months, the BLS plowed the entire adjustment into January of 2026.
We did not suddenly add 2.245 million jobs in January of 2025, all US-Born. (Difference between the dashed blue line and the yellow line).
Moreover, there is no valid historical data on full vs parttime employment, on foreign born employment, and many other BLS data series. And there won’t be. There are no back adjustments key data components.
All posts on foreign-born employment, parttime employment, etc., suffer this flaw. All year-over-year (or December-to January) analysis you find on these stats is permanently flawed.
2025 Experimental Data
In April, the BLS released Experimental series accounting for January 2026 population control effects.
(Official CPS estimates for December 2025 and earlier months have not been revised, in accordance with usual practice.)
Experimental Series
In 2025, BLS produced new experimental time series measures to account for the size and timing of the large population changes reflected in the January 2025 population control adjustment.
The experimental series use the monthly time series (back to April 2020) available from the Census Bureau’s Vintage 2025 population estimates that form the basis of the January 2026 CPS population control adjustment.
The experimental series are smoother over time, as they do not show the annual effects of the population control adjustments that occur each January in the official series.
The experimental series adjusts data back to April 2020, the decennial census reference point.
Standard vs More Accurate Experimental Data
- Between December 2024 and January 2025, the standard data shows an increase of 2,245,000. The adjusted data shows a gain of 692,000.
- For December 2025, the employment level is a reported 163,992,000 vs the adjusted data at 162,557,000.
- By December 2025, the standard data employment level was overstated by 1,365,000. That did not happen in a single month. It was the result of cumulative months of bad data every month for a full year.
By standard practice, the BLS leaves the published data and charts in a known-to-be-wrong state.
Thus, all standard year-over-year household data comparisons are nonsense. Comparisons between January and December of the prior year are also invalid.
Initial Thoughts
I will continue to use what the BLS refers to as “experimental data” because the official household data is admitted nonsense.
This was a poor report following a very good report which in turn followed two disasters.
Here are the latest, undoubtedly wrong, and soon to be revised monthly job report details.
Monthly Job Report Details
- Nonfarm Payroll: +29,000 to 159,044,000 – Establishment Survey
- Civilian Non-institutional Population: +139,000 to 275,554,000
- Civilian Labor Force: +485,000 to 170,262,000 – Household Survey
- Participation Rate: +0.2 to 61.8% – Household Survey
- Employment: +406,000 to 163,152,000 – Household Survey
- Unemployment: +78,000 to 7,109,000 – Household Survey
- Baseline Unemployment Rate: +0.1 to 4.2% – Household Survey
- Not in Labor Force: -346,000 to 105,292,000 – Household Survey
- U-6 unemployment: -0.1 to 7.6% – Household Survey
Nonfarm Payrolls Change by Sector

Nonfarm Payrolls Change by Sector in Thousands
- Nonfarm Payrolls:+29
- Manufacturing: +9
- Construction: +11
- Leisure and Hospitality: +10
- Private Education and Health Care: +20
- Professional and Business Services: -9
- Information: -10
- Financial: -7
- Retail: +6
- Wholesale: +5
- Government: -17
Government Jobs Breakdown
- State: -3
- Federal: -1
- Local: -13
Monthly Revisions
- The change in total nonfarm payroll employment for July was revised down by 31,000, from +21,000 to -10,000.
- The change for August was revised down by 29,000, from +162,000 to +133,000.
- With these revisions, employment in July and August combined is 60,000 lower than previously reported.
Part-Time Jobs
- Involuntary Part-Time Work: +111,000 to 4,501,000
- Voluntary Part-Time Work: +61,000 to 22,813,000
- Total Full-Time Work: +88,000 to 134,376,000
- Total Part-Time Work: +205,000 to 28,746,000
- Multiple Job Holders: +181,000 to 8,986,000
The above numbers never total correctly due to the way the BLS makes seasonal adjustments. I list them as reported.
These numbers are highly unreliable for reasons noted above. Year-over-year comparisons are invalid, period. The BLS does not update these numbers in the experimental data.
Hours and Wages
- Average weekly hours of all private employees was flat at 34.4 hours.
- Average weekly hours of all private service-providing employees was flat at 33.3 hours.
- Average weekly hours of manufacturers was flat at to 40.6 hours.
This data is only as good as the data collection.
Hourly Earnings
This data is frequently revised. Here are the numbers as reported this month.
Average Hourly Earnings of All Nonfarm Workers rose $0.05 to $37.81. A year ago the average wage was $36.70. That’s a gain of 3.0%.
Average hourly earnings of Production and Nonsupervisory Workers rose $0.07 to $32.60. A year ago the average wage was $31.56. That’s a gain of 3.3%.
Accurately counted, these gains are not close to keeping up with inflation.
By accurate counting I mean factoring in homeowner’s insurance, property taxes, and tips on food. All three are excluded from the CPI. The BLS weights on food at home vs away are also wrong.
Unemployment Rate

Alternative Measures of Unemployment

Table A-15 is where one can find a better approximation of what the unemployment rate really is.
- The official unemployment rate is 4.2 percent.
- U-6 is much higher at 7.6 percent.
Both numbers would be way higher still, were it not for millions dropping out of the labor force over the past few years.
Some of those dropping out of the labor force retired because they wanted to retire. Some dropped out over Covid fears and never returned. Still others took advantage of a strong stock market and retired early.
The rest is disability fraud, forced retirement (need for Social Security income), and discouraged workers.
The entire series is flawed by non-applied annual benchmark revisions.
The series is also flawed by poor response rates, deportations, illegals not answering phones, sampling errors and non-sampling errors.
Birth Death Model
Starting January 2014, I dropped the Birth/Death Model charts from this report.
The birth-death model pertains to the birth and death of corporations not individuals except by implication.
For those who follow the numbers, I retain this caution: Do not subtract the reported Birth-Death number from the reported headline number. That approach is statistically invalid.
Birth-Death Methodology Explained
I gave a detailed explanation of the model and why the usual calculation is wrong in my June 8, 2024 post How Much Did the BLS Birth-Death Adjustment Pad the May Jobs Report?
I repeat, do not subtract the birth-death number from the headline number.
Household Survey vs. Payroll Survey
- The payroll survey (sometimes called the establishment survey) is the headline jobs number. It is based on employer reporting.
- The household survey is a phone survey conducted by the BLS. It measures employment, unemployment and other factors.
If you work one hour, you are employed. If you don’t have a job and fail to look for one, you are not considered unemployed, rather, you drop out of the labor force.
Foreign-Born Employment
The numbers in my charts are seasonally adjusted. Foreign born employment is not adjusted, compounding comparison errors.
And we have no BLS revised data for foreign born employment. So, all such foreign and US-born comparisons with BLS data remain nonsense.
A second major problem with foreign-born employment is the BLS makes no distinction between US citizens who were foreign born and genuine foreign workers.
Comments on BLS Data
The BLS monthly data is garbage.I do the best with BLS data that I can, or anyone can.
The quarterly QCEW and Business Employment (BED)reports represent a 96 percent sample. But those reports lag by about 5 months.
The Birth-Death model that feeds the monthly jobs report is bogus. It has been screwed up since Covid, first underreporting jobs then overreporting them.
QCEW and BED data show more jobs are now being lost in closing businesses than gained in new businesses.
Annual revisions have been lower for three consecutive years.
However, there are hints from QCEW that the bulk of negative annual revisions may finally be in the past.
Final Thoughts
One has to wonder how messed up the Household phone survey is due to response rates from illegal aliens.
Are illegal immigrants answering these surveys? If not, then other individuals are overweighted.
The establishment data is also suspect. Are minority firms or firms dependent on immigrants answering these surveys?
I think not, and if not, then survey responses from firms not dependent on immigrants are overweight, boosting the numbers.
Related Posts
September 30, 2026: Real Personal Income Fell 0.1 Percent August, Real Spending Jumped 0.6 Percent
Real incomes are down but spending surged.
October 1, 2026: Trade Deficit Surges in 11.5 Percent in August
Tariffs did not and will not eliminate trade deficits.
October 1, 2026: ISM Manufacturing Expanded in September for the Ninth Consecutive Month
Input prices up 24 months, increasing faster.






























Time and convenient “surprise” for the bond market and administration.
I am not sure if anyone tracks small business openings/closings but where I live shops are closing like crazy but the ones that are staying open are desperate for help so we are in a very strange steady state
Wages should be rising but they are not, the small businesses that are staying afloat can not afford it
If you can’t trust the revisions, how do you trust the headlines?
OR
If you can’t trust the headlines, how do you trust the revisions?
.
That’s why we ask you how much you’re paying for diesel, to hear it from the horse’s mouth directly!
It is $6.79 at my station. I pay less with a pre-paid contact.
Even with this weakness, after initially dropping, the yield on the 10 year is up to 5.29% again.
The jobs report was very good in the sense that we only need something like 20k-40k jobs per month to fill the needs of the present labor force. Yes, in the old world pre-covid it was 150,000.
Dumb retail buying stocks on ‘bad news is good news’ today. The news actually wasn’t that bad. Market stopped buying treasuries when they realized that 29k was actually a good number.
Weak volumes in the indicies that are floating on air. The Market is still waiting for the next Trump stimulus or gimmick. Micron flat to down tells you where this market is heading. Analysts increase price targets for MU and the stock goes nowhere. Micron should have been up 10-20% to keep the myth of AI supremacy going.
Please further elaborate why this is a good jobs report.
I am curious given the state of the bottom 80%, a lackluster productivity gains in the workplace, over leveraged debt causing deflation spending for the working class, de-industrialization, and financial capitalism as the dominant extraction model?
Who answers any phone survey?
Retired people and strippers who don’t work until later?
i’m retired and thinking of becoming a stripper.