

Is May the Shipping Bottom?
The Cass Freight Report suggests April is the bottom while blaming what has happened as a self-inflicted wound.
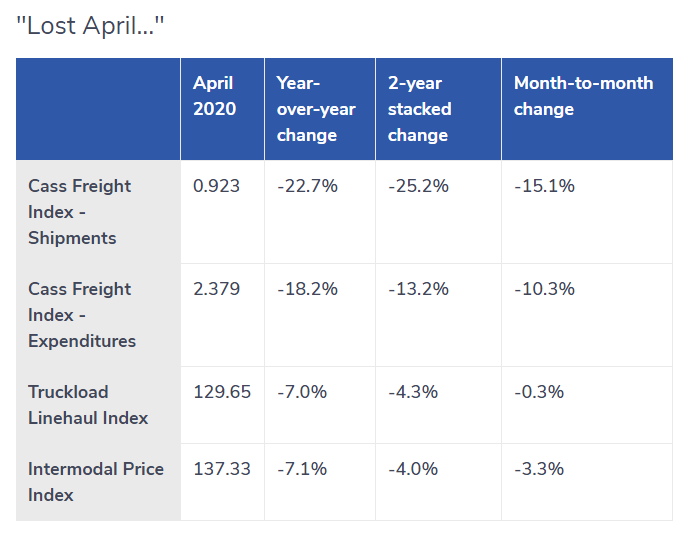
The Cass Freight Index showed the expected big dip in activity last month, after all the March consumer panic buying subsided, leaving us with just the negative impact of shut-in orders and rising unemployment levels. For April, the overall index for both shipments and expenditures fell sharply y/y to recessionary levels. This is concerning but would be more concerning if it weren’t a self-inflicted wound. Businesses and mobility were severely limited by unprecedented governmental restrictions in April, and those are loosening here in May and should further loosen on their way back to “normal” in June.
Cass April Shipping Level

Cass Freight Index

There are many addition charts and the report is well worth a look, but here is another snip that caught my eye.
Shipment volumes dropped 22.7% vs April 2019 levels, and we believe this will mark the bottom. May should be better, as the U.S. economy slowly begins to re-open and some manufacturing plants turn back on (many automotive OEMs are targeting plant re-openings in the next week or two).
Self-Imposed
Covid was not self-imposed.
US Covid-19 Deaths

March, April, May
- March 13, 2020: 40
- April 13, 2020: 22,108
- May 13, 2020: 82,387
The above data points are from Our World.
In precisely two months, the number of US Covid-19 deaths went from 40 to 22,108 to 82,387.
And those deaths are way underestimated by any rational measure although numerous poorly-written articles and theories claim otherwise.
Cass Freight Index Showed Economic Weakness Way Before the Pandemic
I commented on that aspect last month in Cass Freight Index Showed Economic Weakness Way Before the Pandemic
Ever since Cass outsourced production of this report to Stifel, the Cass report been one of rampant overoptimism.
The original writers (named Cass) were sounding recession signals whereas Stifel writer David G. Ross, spoke of signs of a freight bottom for the last few months.
We can never prove which view is correct, but seeing signs of a bottom in a recovery that was already the longest in history seems more than a bit questionable.
Not Self-Inflicted
This was not self-inflicted although we do not know and never will how many deaths would have occurred had the US done nothing.
Key Rebuttal Points
- Even had the US done nothing, with the rest of the world shut down and supply chains totally wrecked, precisely how was US manufacturing supposed to stay intact?
- With deaths soaring to 82,387 from 40, it is irrational to presume bar and restaurant traffic would have done anything other than collapse.
Bottom In?
Perhaps Ross is correct. But that is not the issue.
The speed and shape of the recovery are the issues.
Fed’s Three-Point Assessment
Fed Chair Jerome Powell gave this assessment today:
- “The path ahead is both highly uncertain and subject to significant downside risks.”
- “The loss of thousands of small- and medium-sized businesses across the country would destroy the life’s work and family legacy of many business and community leaders and limit the strength of the recovery when it comes.”
- “The result could be an extended period of low productivity growth and stagnant incomes.”
Negative Rates Not an Option
For discussion of those points and also the Fed’s assessment of negative interest rates, please see Negative Rates Are Not an Option
Realistically, we should now toss ideas of a bottom in April (as the Cass report suggested last month) or even May, as the latter is essentially irrelevant.
Unfortunately, the Covid-19 Recession Will Be Deeper Than the Great Financial Crisis.
Don’t expect a V-shaped recovery.
That thought applies to restaurants, manufacturing and shipping as a direct consequence.
Mish






























I hate to say this but the really painful part of this economic correction is still to come.
The underlying issue of our economic problems is that we have inflated assets to unsustainable levels to support ever increasing borrowing.
Assets are going to be revalued going forward, and that is going to be a real reckoning.
Many people who think they have a good amount of wealth in home equity and retirement accounts are going to find out that they are actually broke when assets begin to deflate.
Just the facts.
Today’s initial unemployment claims.
Consensus … 2.5 million
range of “experts” … 2.45 million to 2.6 million
actual … 2.981 million
Houston, we have a …
good article Mish.
In western nova scotia we have had 54 cases for the last 3 weeks no new cases in three weeks. the province as a whole has had some additional cases mostly in nursing homes they have been in the single digits. When I Rarely go to town about 1/2 the people wear masks no one gets close people are social distancing ins stores. . I think Mc Neil has had a consistent message from the start. “Stay the Blazes Home” . New Brunswick has not had a new case in a long while. So many people barking about freedom but in reality your freedom ends at the tip of my nose and the virus means at least 6 feet away. If everyone would have listened from the start it would be all over now. Instead the freedumb fighters have managed to make it a two or three year crisis. good job.
“The speed and shape of the recovery are the issues.”
A news report this morning from some analyst said that 40% of the job losses were “permanent.”
Oh, so more of the same then. Seriously, doesn’t that describe the past 10 years for non-asset holding Americans?
Everyone talking about the “shape” of the recovery is assuming there will be a recovery. Seems likely the US economy after the pandemic will be fundamentally different — flattened — compared to before. How can there be a genuinely productive system of finance and commerce with endless NIRP and $50+ (just wait) trillions of gov debt?
Mish, you nailed it perfectly. Your assessment is spot on. We have difficult times going forward, and the people need a clear understanding of just what is happening and why. Thank you for your good work.
Mish, are you saying the response that we took to shut down most businesses was the best and optimal strategy? Why don’t we do this for the flu? Are there no other strategies that would have worked as well (or even better) without doing as much damage to the economy?
Seems to me, there is a lack of imagination here. But then, this is to be expected from government.
Hindsight is 20/20. Easy to criticize decisions you didn’t have to make.
Why don’t we do this for the flu?
Because Covid is at least 10 times more deadly – requires more hospitalization, etc.
That said, we can debate the actions takes, when and how.
Mish, have you analyzed fatality rate by age by comorbidity for COVID-19 versus the flu? As you know, the oft-quoted flu fatality rate of 0.1% is an average for the entire population. I’ve tried to crunch the numbers for COVID-19, and the fatality rate for older folks with comorbidties was one log higher than the average flu mortality rate, but two logs lower for younger groups. Curiously, for older folks without comorbidities, the COVID-19 fatality rate was lower than the average flu fatality rate. It may be that the COVID-19 fatality rate for older folks is dramatically higher than the flu rate for these age groups due to no preexisting immunity to the virus and an immune system incapable of developing immunity, not the case for younger foks. Whereas older folks have remnants of pre-existing immunity to the flu developed at an earlier age. That is, that the claim that COVID-19 is deadlier than the flu may be true using an average rate for the entire population, but may not be true for younger age groups, due to an overweighted fatality rate in the aged population for reasons described. This is relevant for setting effective policy.
You make a very important point that I doubt epidemiologists have missed in preparing their analysis to guide the politicians in making policy decisions.
I see no evidence of this. Can you direct me to any presentation by Fauci advising that we lock down nursing homes? Can you direct me to any presentation by Fauci illustrating fatality rate by age by comorbidity? The head of the LA public health department is not an MD, not an infectious disease specialist, not an immunologist. She has a PhD in Social Welfare. As she is from Puerto Rico, which incidentally according to the CIA facebook is mostly white, she can claim to be a minority and is likely an affirmative action appointment.
Laws and public orders are really not put in place for the average citizen. The average citizen does not need to be told to self quarantine any more than they need to be told not to rob liquor stores.
It is always the lowest tiers of society that laws and rules are put in place to control.
Most people are reasonable and act in a civilized manor, it is the few that refuse to act civilized that make the government mandates necessary.
“With deaths soaring to 82,387 from 40, it is irrational to presume bar and restaurant traffic would have done anything other than collapse.”
Thank you, Mish. This is what people who complain about the lockdowns miss. Even if there were no government mandated lockdowns, fear would set in after the death rate exploded. Fear would keep people home anyway, so you would still get an economic hit after taking an even higher mortality hit.
The government didn’t mandate that people panic buy and horde a 5 year supply of toilet paper. Fear did that.
The lockdowns and distancing were effective, now people are getting complacent and saying they were never needed. If we’re not careful we’re going to get ourselves right back on the exponential growth curve.
I live in an area that was not hard hit by the coronavirus (four cases in the entire county). Our state still had mandatory quarantine, but with many caveats (I could still go fishing, etc.), but all the restaurants, bars, and other dine-in spots closed. The area where I live is dependent on tourism and rich, upper-middle-class retirees to buy or build their dream house here. Lots of low-wage jobs inherent in such a model. Restaurants open next week; I am hopeful for a local V-shaped recovery, just to get people back to work. But the bigger picture, nationally and regionally? Yikes. Sad.
Cluelessness reigns:
“snowstorm”. Seriously?
cnbc in March
Ben Bernanke, the former Federal Reserve chairman who served before and after the 2008 financial crisis, told CNBC on Wednesday the coronavirus economic halt is more like a “major snowstorm” than an economic depression.
“This is a very different animal than the Great Depression,” Bernanke stressed. “The Great Depression, for one thing, lasted for 12 years, and it came from human problems: monetary and financial shocks that hit the system.”
“This has some of the same feel of panic, some of the feel of volatility,” he said in a “Squawk Box” interview. “It’s really much closer to a major snowstorm or a natural disaster than it is to a classic 1930s-style depression.”
Bernanke said he does expect a “very sharp” U.S. recession, but also a “fairly quick” recovery.
He also said: https://www.youtube.com/watch?v=RZQh2csdT8Q
He would have been right, if there weren’t a massive Everything Bubble just waiting for something to pop it when this hit. The virus is what will kill the economy. People in debt up to their eyeballs outbidding each other for 10 years for the same old crap is what is killing the economy.
A year round snowjob that keeps everyone from leaving home, sort of explains masks….oh dear…I’ll be quiet 🙁
92 percent of Cook County COVID-19 victims had pre-existing conditions
A Wirepoints analysis of COVID-19 deaths from the Cook County Medical Examiner’s office reveals that 92 percent of victims from the virus had pre-existing medical conditions.*
The medical examiner’s database showed COVID-19 as the primary cause of death for 2,303 people. Of those, 2,112 were shown to have at least one underlying condition as a secondary cause of death. Those conditions, also known as comorbidities, included hypertension, diabetes, obesity and heart disease. There were no secondary causes reported for 191 deaths.
This finding is important because Gov. J.B. Pritzker has refused to release any statewide comorbidity data as part of his official Illinois Department of Health releases. Wirepoints asked for data directly from the governor’s office on April 21st, but we were told it was not available. We’ve since released a piece asking Gov. J.B. Pritzker why that’s so: Who’s most at risk for COVID-19 and why isn’t Illinois publishing that data?
Understanding who is most at risk – and who is not – is central to a public understanding of the virus. It’s also central to helping decide when and how to open up our economy and schools. What Cook County’s and other comorbidity data across the country implies is that the risk of death for healthy Illinoisans is far lower than Gov. J.B. Pritzker might lead people to believe based on his protracted lockdown and drawn out reopening plan.
Cook County reports that of the 2,303 victims where COVID-19 was listed as the primary cause of death, 92 percent had one or more comorbidities.
973 victims, or 42 percent of the total. Pulmonary disease was part of 397 deaths, or 17 percent. And 215 of those deaths, about 9 percent, were accompanied by obesity or morbid obesity.
Yet others had conditions including cancer and cardiovascular and kidney diseases. The numbers above add up to more than 100 percent because many victims had more than one pre-existing condition.
The Cook County data lines up with city of Chicago data on comorbidities for city deaths. Though the city does not provide any broader detail, it does report that 1,090 of Chicago’s 1,160 COVID-19 deaths had underlying conditions. That’s 94 percent.
What’s stark about the Cook comorbidity data is just how few young adults die from COVID-19 in the absence of some pre-existing condition. Just 3 of the 15 deaths in the 20-29 age bracket had no comorbidities. Same goes for the 30-39 and 40-49 age brackets, where just 26 of the 132 deaths were accompanied with no underlying causes.
The above data is key to mapping out a reopening strategy for schools, universities and workplaces. Younger, healthier adults face far less risk from COVID-19 than originally feared.
On the flip side, it shows who is at risk: anyone with pre-existing conditions, including the elderly. As of May 8, the average age of all COVID-19 deaths in Illinois was 74, a clear sign of where the true risk lies.
Even more, almost 50 percent of all Illinois deaths have been tied to long-term care facilities, the subject of an upcoming Wirepoints piece. That means nearly 1,600 deaths occurred outside the general public.
For months, Illinois residents have lived in fear, a fear that has been exacerbated by a lack of transparency and open reporting from the state. The state didn’t release hospitalization data until outside pressure forced it to. Antibody testing results are still being held back, which we wrote about in With New FDA Action, Gov. Pritzker and Dr. Ezike Have No Excuse for Further Stonewalling Antibody Testing.
And Wirepoints shouldn’t be forced to seek out and compile partial comorbidity data based on tips from others. The state should be open and transparent with all of its COVID-19 statistics.
Regardless, the data continues to be revealed, even with the state’s stonewalling. The information we now know paints a compelling case for a far different reopening plan than Gov. Pritzker has introduced.
*Hat tip to CWB Chicago for making us aware of the examiner’s online database. The link to the examiner’s office is here.
Click here for the full list of Cook County COVID-19 victims
Who doesn’t have a pre-exsisting condition of some sort? From childhood bronchitis to old age hardening of the arteries
Washington State numbers are similar.
Those 80 and older are 9% of cases, 52% of deaths.
Those 60 to 79 are 22% of cases, 39% of deaths.
Those under 40 are 35% of cases, 1% of deaths.
This knowledge has been known for a while and should have been factored in to the initial and continuing response.
Missouri joins states across the nation investigating possible cases of a rare inflammatory syndrome in children that is believed to be linked to the coronavirus and has led to at least three deaths in New York City.
As doctors learn more about the symptoms, St. Louis Children’s Hospital reported Wednesday it has possibly seen at least two cases, one in which the patient was in the hospital for two weeks.
“Those conditions, also known as comorbidities, included hypertension, diabetes, obesity and heart disease. “
42% of Americans are obese. Add in all the other bits, and well over half the population has a target on their backs.
And if you add in the people who live with someone with a comorbidity factor, it is even higher. If the young and healthy are living with someone who is not, then that needs to be a consideration also.
Incorrect. Age is number one. Age and comorbidity raises risk substantially. Age and no comorbidity, no problem. This is an oppression by folks who don’t take care of themselves, excepting those with bad luck genes. Don’t make others pay for your inability to quit stuffing your pie hole.
Slightly off topic but I’m going to throw in a link for europe personal savings, and after that a chart on Spanish serology tests. Often you talk how little anyone has saved in the US, the below link looks at europe. 12 % of europe cannot afford food if earned income is taken away for two months. Take away pensions and public transfers and a quarter of europe does not have cash or deposits to last two months
This is the result of one of the first full government serology surveys conducted anywhere, in Spain
where the meaning of the results are still being understood. What is unusual is the whole central plateau is much higher than the rest of Spain. This could be climate but I am not convinced, temperatures are not so very very different from the coast. Other provinces with lower infection rate also have large capital cities.
So I also wonder if there is susceptibility by ancestry , e.g.
It is a bit far fetched maybe, but at least worth refuting. The apparent discrepancy with northern italy is explainable if there were also a high level of replacement of italo celtic there but still high italo celtic, the lombards were a northern european tribe if I remember.
Really interesting stuff. Climate doesn’t seem likely, since as you state above it’s not all that different. In fact the climate seems to band from east to west.
What’s also quite interesting is that the areas with the highest rates are those with the lowest population densities. They ARE probably those with the older populations.
The Celtic/Italic angle is also a really interesting suggestion. In the UK, the NHS is considering removing black and Middle Eastern medical staff from the front lines because of a higher risk of severe illness which cannot be fully explained by other factors.
My eyes were drawn to two islands in the Med – Corsica and Sardinia. Very close to each other, one very Italic, one not so much. If your geography is not good, you are looking to the two large islands to the left of centre.
Corsica has 53 deaths and a population of 330000. 160 deaths per million.
Sardinia has 120 deaths and a population of 1.6m. 75 deaths per million.
Lots of things could explain that, of course, but interesting that Corsica has a median age of 38 against Sardinia’s 46, and Corsica’s population density is half that of Sardinia’s. If you wanted to put bets on which country would have the highest death rate, based on those facts alone, you’d put all your money on Sardinia.
Very thought provoking, thanks for posting.
There are so many variables it is hard to draw any conclusions about anything with this virus, so patterns are just that, correlation not meaning causation etc.
The north of Portugal was also worst effected , around Porto, which fits with the map. I don’t know, but there is definitely some unknown factor at work. Barcelona or Malaga region have very urban populations, big cities, yet are below infection rate of rural provinces of the plateau. I don’t see any reason for outbreaks to have only started well ahead in Madrid and not in other regional cities around the same time, so the idea it sort of emanated outwards from Madrid is hard to justify.
The virus so far seems to pick its victims at random, apart from old or infirm, and outbreaks have been very disimilar in different countries and sometimes different ethnic group, there are some obvious reasons for that, but there are also differences that don’t make sense.
It’s a shame we don’t have proper data on China, Wuhan going back to near zero cases is quite a feat. France also seems to have avoided much of the worse but hard to explain how.
There is a lot that is odd going on, sure there are good explanations, somewhere.
Interestingly, today the UK’s Daily Mail paper (not exactly a literary title, but occasionally by accident they publish something that is useful) listed the R value by area. What I found amazing is that the R value in London is about HALF the value elsewhere in the country. That is quite astounding given that the papers are full of people still crowding onto public transport, congregating in parks, etc.
London has a very high non-white population, so this doesn’t support your model but does tie in with your comments about Barcelona and Malaga.
As for China, something else I saw this week in UK data (will try to find it again). The ethnic group LEAST likely to die from this disease is…..
This is where you need Mish’s “click on chart for sharper image”.
Do you have a better version of this???
There is a good map on this page
As long as rent and mortgage is included in “basic expenses”, in a financialized world, most people barely being able to meet them, is unavoidable. If people had any money left over, rents and mortgages would rise.
For the exact same reason it doesn’t matter how much money someone within seconds of dying from dehydration in a dessert has; as long as Goldman Sachs has successfully lobbied for zoning laws banning anyone else from competing with them as water suppliers.
The only way to avoid that is outright ownership of own property. There are so many disincentives to that nowadays, and even those who do often view it as a financial asset also. Also finance makes it that you cannot afford prices without finance, catch 22…the whole show is based on making property “more affordable” (via payment schedule)… I would prefer lower prices instead. It’s one main reason the public are involved in the race to zero rates – mortgage costs / own property values.
“The only way to avoid that is outright ownership of own property.”
Yes. Including full ownership of the decision as to what to do with it. Meaning, transforming it from a run down shack, to a 100 unit, high quality, tower.
As well as taking full ownership of paying for the legal and policing infrastructure required to keep your ownership claim protected.
All without pseudo obfuscated handouts by way of below-market interest rates nor inflation.
I’d like to point out that you (Mish), already last year reported on shipping weakness, slowdown in manufacturing, Fed repos etc.
I’m greatful to be able to read your work for free, it has definitely helped me to prepare for what’s coming.