
Employment dropped by 507,000. The unemployment rate fell because the labor force plunged by 720,000. 
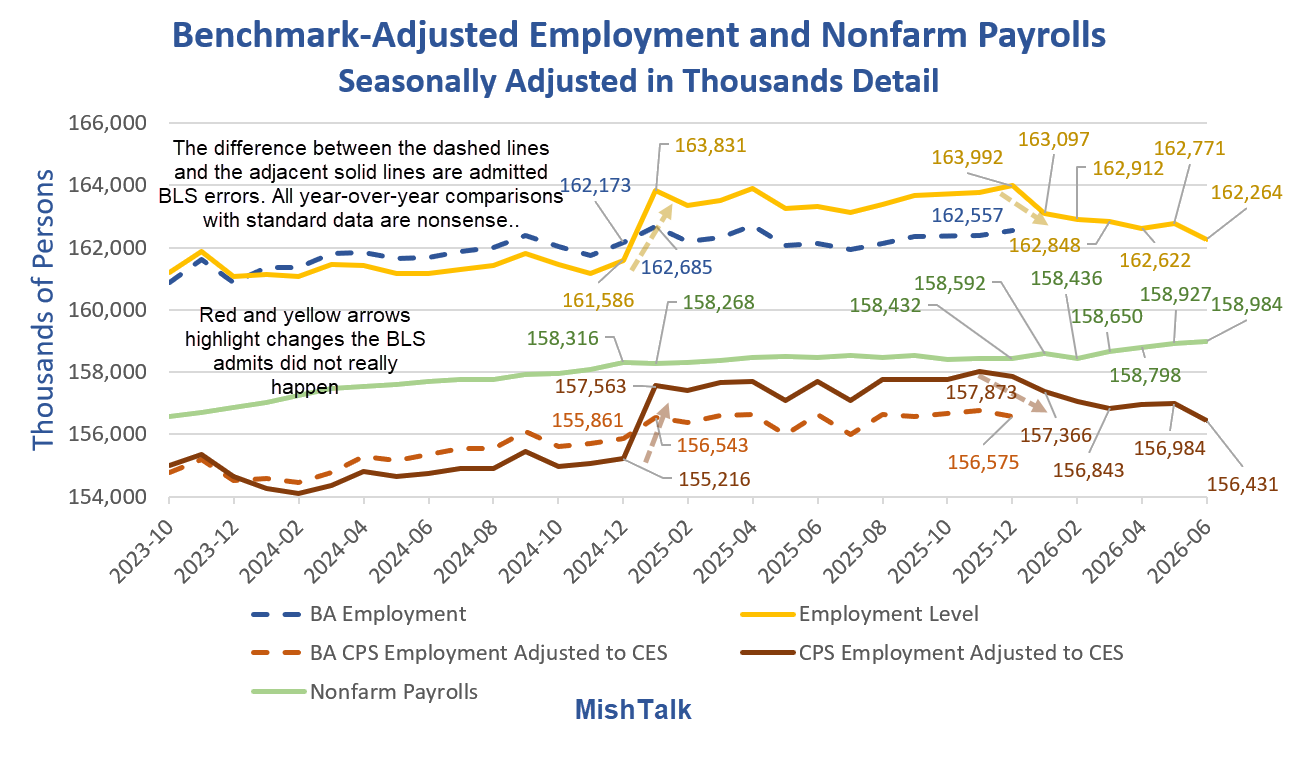
Understanding the Lead Chart
Note: If you have seen this explanation, please skip to down to the subtitle “Initial Thoughts” to continue reading.
Every January (typically), the BLS has annual revisions to nonfarm payrolls and household population employment. The BLS does not back revise the household charts.
Because the BLS does not back revise, we see ridiculous numbers such as employment rising by over 2 million in a month (first yellow arrow).
To correct for the population adjustments, the BLS provides an adjustment series to normalize employment levels to match nonfarm payrolls. The BLS calls this “experimental” data but the regular posted data is admitted nonsense.
The experimental series is LNS16000000, “Employment Adjusted to CES Concepts“.
For 2024, the BLS admits that it undercounted employment by 2 million. Instead of parsing that out in the correct months, the BLS plowed the entire adjustment into January of 2025.
For 2025, the BLS admits that it overcounted employment by 1.4 million. Instead of parsing that out in the correct months, the BLS plowed the entire adjustment into January of 2026.
We did not suddenly add 2.245 million jobs in January of 2025, all US-Born. (Difference between the dashed blue line and the yellow line).
Moreover, there is no valid historical data on full vs parttime employment, on foreign born employment, and many other BLS data series. And there won’t be. There are no back adjustments key data components.
All posts on foreign-born employment, parttime employment, etc., suffer this flaw. All year-over-year (or December-to January) analysis you find on these stats is permanently flawed.
2025 Experimental Data
In April, the BLS released Experimental series accounting for January 2026 population control effects.
(Official CPS estimates for December 2025 and earlier months have not been revised, in accordance with usual practice.)
Experimental Series
In 2025, BLS produced new experimental time series measures to account for the size and timing of the large population changes reflected in the January 2025 population control adjustment.
The experimental series use the monthly time series (back to April 2020) available from the Census Bureau’s Vintage 2025 population estimates that form the basis of the January 2026 CPS population control adjustment.
The experimental series are smoother over time, as they do not show the annual effects of the population control adjustments that occur each January in the official series.
The experimental series adjusts data back to April 2020, the decennial census reference point.
Standard vs More Accurate Experimental Data
- Between December 2024 and January 2025, the standard data shows an increase of 2,245,000. The adjusted data shows a gain of 692,000.
- For December 2025, the employment level is a reported 163,992,000 vs the adjusted data at 162,557,000.
- By December 2025, the standard data employment level was overstated by 1,365,000. That did not happen in a single month. It was the result of cumulative months of bad data every month for a full year.
All standard year-over-year household data comparisons are nonsense. Comparisons between January and December of the prior year are also invalid.
Initial Thoughts
I will continue to use what the BLS refers to as “experimental data” because the official household data is admitted nonsense.
This report was a a disaster. Employment fell by over half a million. The unemployment rate fell because over 700,000 left the labor force.
Economists expected a gain of 114,000. Counting negative revisions, the economy shed 17,000 compared to the initial May report.
Here are the latest, undoubtedly wrong, and soon to be revised monthly job report details.
Monthly Job Report Details
- Nonfarm Payroll: +57,000 to 158,984,000 – Establishment Survey
- Civilian Non-institutional Population: +112,000 to 275,156,000
- Civilian Labor Force: -720,000 to 169,358,000 – Household Survey
- Participation Rate: -0.3 to 61.5% – Household Survey
- Employment: -507,000 to 162,264,000 – Household Survey
- Unemployment: -213,000 to 7,094,000 – Household Survey
- Baseline Unemployment Rate: -0.1 to 4.2% – Household Survey
- Not in Labor Force: +832,000 to 105,808,000 – Household Survey
- U-6 unemployment: -0.2 to 7.9% – Household Survey
Nonfarm Payrolls Change by Sector

Nonfarm Payrolls Change by Sector in Thousands
- Nonfarm Payrolls: +57
- Manufacturing: +3
- Construction: +11
- Leisure and Hospitality:-61
- Private Education and Health Care: +69
- Professional and Business Services: +36
- Information: -9
- Financial: 0
- Retail: -8
- Wholesale: 2
- Government: +8
Government Jobs Breakdown
- State: +4
- Federal: +2
- Local: +2
Monthly Revisions
- The change in total nonfarm payroll employment for April was revised down by 31,000, from +179,000 to +148,000
- The change for May was revised down by 43,000, from +172,000 to +129,000.
- With these revisions, employment in April and May combined is 74,000 lower than previously reported.
Last month we had a rare upward revision to jobs. That’s now wiped out.
BLS Notes: “The 2026 Preliminary Benchmark Revision to Establishment Survey Data will be published on August 28, 2026. This is the same day that the first-quarter 2026 data from QCEW will be issued.”
“Official establishment survey estimates are not updated based on this preliminary benchmark revision.”
By standard practice, the BLS will leave the published data and charts in a known-to-be-wrong state. This is why I use the alleged “experimental” data.
Part-Time Jobs
- Involuntary Part-Time Work: -135,000 to 4,615,000
- Voluntary Part-Time Work: -235,000 to 22,618,000
- Total Full-Time Work: -514,000 to 133,659,000
- Total Part-Time Work: -57,000 to 28,626,000
- Multiple Job Holders: +126,000 to 8,554,000
The above numbers never total correctly due to the way the BLS makes seasonal adjustments. I list them as reported.
These numbers are highly unreliable for reasons noted above. Year-over-year comparisons are invalid, period. The BLS does not update these numbers in the experimental data.
Hours and Wages
- Average weekly hours of all private employees was flat at 34.3 hours.
- Average weekly hours of all private service-providing employees was fell 0.1 hours to 33.2 hours.
- Average weekly hours of manufacturers was fell 0.1 hours to 40.3 hours.
A tenth of an hour does not sound like much. But multiplied across 158 million, that’s a lot of hours.
Of course, this data is only as good as the data collection.
Hourly Earnings
This data is also frequently revised. Here are the numbers as reported this month.
Average Hourly Earnings of All Nonfarm Workers rose $0.13 to $37.64. A year ago the average wage was $36.36 That’s a gain of 3.5%.
Average hourly earnings of Production and Nonsupervisory Workers rose $0.07 to $32.38. A year ago the average wage was $31.31. That’s a gain of 3.4%.
Accurately counted, these gains are not close to keeping up with inflation.
By accurate counting I mean factoring in homeowner’s insurance, property taxes, and tips on food. All three are excluded from the CPI. The BLS weights on food at home vs away are also wrong.
Unemployment Rate

Alternative Measures of Unemployment

Table A-15 is where one can find a better approximation of what the unemployment rate really is.
- The official unemployment rate is 4.2 percent.
- U-6 is much higher at 7.9 percent.
Both numbers would be way higher still, were it not for millions dropping out of the labor force over the past few years.
Some of those dropping out of the labor force retired because they wanted to retire. Some dropped out over Covid fears and never returned. Still others took advantage of a strong stock market and retired early.
The rest is disability fraud, forced retirement (need for Social Security income), and discouraged workers.
The entire series is flawed by non-applied annual benchmark revisions.
The series is also flawed by poor response rates, deportations, illegals not answering phones, sampling errors and non-sampling errors.
Birth Death Model
Starting January 2014, I dropped the Birth/Death Model charts from this report.
The birth-death model pertains to the birth and death of corporations not individuals except by implication.
For those who follow the numbers, I retain this caution: Do not subtract the reported Birth-Death number from the reported headline number. That approach is statistically invalid.
Birth-Death Methodology Explained
I gave a detailed explanation of the model and why the usual calculation is wrong in my June 8, 2024 post How Much Did the BLS Birth-Death Adjustment Pad the May Jobs Report?
I repeat, do not subtract the birth-death number from the headline number.
Household Survey vs. Payroll Survey
- The payroll survey (sometimes called the establishment survey) is the headline jobs number. It is based on employer reporting.
- The household survey is a phone survey conducted by the BLS. It measures employment, unemployment and other factors.
If you work one hour, you are employed. If you don’t have a job and fail to look for one, you are not considered unemployed, rather, you drop out of the labor force.
Foreign-Born Employment
The numbers in my charts are seasonally adjusted. Foreign born employment is not adjusted, compounding comparison errors.
And we have no BLS revised data for foreign born employment. So, all such foreign and US-born comparisons with BLS data remain nonsense.
A second major problem with foreign-born employment is the BLS makes no distinction between US citizens who were foreign born and genuine foreign workers.
Net Job Creation by New Businesses Is Negative

For details, please see my May 4 post Net Job Creation by New Businesses Is Negative Once Again
More jobs are lost in closing businesses than gained in new businesses.
The Business Employment Dynamics (BED) data shows a net loss of 159,000 jobs for 2025 Q3 and a net loss of 321,000 jobs for 2025 Q2.
Negative numbers are not the norm outside of recessions.
The BED and QCEW reports are very accurate but lagging.

Also note Manufacturing Is the Biggest Net Loser in Jobs, 5 Quarters Total
Here’s a breakdown of BLS Business Employment Dynamics (BED) by sector.
For more manufacturing charts click on the above link.
Final Thoughts
The BLS monthly data is garbage.I do the best with BLS data that I can, or anyone can.
The quarterly QCEW and Business Employment (BED)reports represent a 96 percent sample. But those reports lag by about 5 months.
The Birth-Death model that feeds the monthly jobs report is bogus. It has been screwed up since Covid, first underreporting jobs then overreporting them.
QCEW and BED data show more jobs are now being lost in closing businesses than gained in new businesses.
Annual revisions have been lower for two consecutive years.
However, there are hints from QCEW that the bulk of negative annual revisions may finally be in the past.
Of course, a recession would change that outlook. I will do a post on this soon.


As I’ve said when I worked at a very large telecomm company: Look, the employees AND the customer are the enemy, we’re just here for the profits.
Most companies want valuations and profits like the big techs enjoy and the damn employees get in the way. Oh, and the demanding customers too–we have to find a way to get their money without the headache of providing them business with its cocomitant overhead and problems.
It was and is a really interesting time.
Curious question regarding job opportunities (my wife & I are retired without children).
For those with children or grandchildren being juniors or seniors in high school, with the rapidly changing job market, what direction would you point your kids to? College, tech school, trades, medicine, arts, military etc. ??
I’m at a loss at what the opportunities are now, and what they will be a few years into the future.
health care
Trades like electrician, plumbing, tile wont be replaced.
Automation will get trucking
EVs will eventually kill mechanics jobs
Add robotics — more so the hardware side then the software side
maybe Mish will explore this: Despite advancing the United States-Mexico-Canada Agreement (USMCA) as a replacement for the North American Free Trade Agreement (NAFTA) during his first term, President Donald Trump announced he has become much less interested in renewing the trade deal — a deal that he created.
I expect to comment on that
meanwhile: lets make money on fires
https://www.hcn.org/articles/people-are-betting-on-wildfires-should-they/
Stating the obvious:
That is scary since wildfires are often man made and there are a lot of crazies out there! Even though it would be fairly easy to catch the pattern of arsonist/bet collector, the damage would already be done.
The sky high stock valuations supports a lot of luxury spending.
Shrinkage is to be expected.
Luxury golf clubs, and rents extracted from the peasants thereby employed, will fill any holes.
Probably your best post of all time, below:
https://mishtalk.com/economics/cancer-free-i-beat-prostate-cancer-mish-the-guinea-pig/
The US Navy said it met this year’s recruiting goal 4 months early. There is an inverse relationship between civilian and military recruiting. If the Navy met it’s goal so early, the ability to get a civilian job must stink.
Or the cost of college is finally reaching insane levels.
Or maybe a whole lot of people want to visit Iran in person 😂
If they land troops, its’s going to look like that scene in Starship Troopers where the bugs overrrun the Mormon compound. Except with drones instead of bugs.
Seems almost like a tactic… forces the poor kids to join and leaves the wealthy ones safe at home when the invasion starts.
Who needs a draft?
That’s a little tinfoil hatty, I suppose. Most likely it’s just more of the serendipitous stupidity that has kept this shitshow on the road this far.
Uncle Schlomo Wants You!
This has a feel of 2007 and 2000.
OMG…”The EU’s top court has ruled that private individuals can face criminal prosecution for posting RT videos on public websites, widening the bloc’s crackdown on Russian media.”
Mish, your comment platform provider bans links to RT. So, here is just the path.
russia/642490-eu-court-rt-germany
Russia has such crushing resources reserves, that if it wasn’t such a governance catastrophe for its people, it could be prosperous, and not feel the need to arm-twist elsewhere, or propagandize breathlessly.
Yes, because RT has these pied piper-like powers bordering on psychic mind control.
Obviously nobody needs freedom of speech!
They cling to misery. It’s kind of their main thing.
This is what happens in a system of Oligarchs that dominate all major businesses, utilities and resource extraction entities. Russia is a great example of what the US civilian population has to look forward with our centralized government run by massive corporations.
https://www.rt.com/russia/642490-eu-court-rt-germany/
No ban on links to RT
@Mish
Perhaps the system treats your comments differently, since you are marked as a moderator or site owner.
In my experience, it blocked — er, “auto moderated” — my post every time I linked to RT, without blocking links to other sites.
How many links?
Try one now – Just one in a comment
With the escalation trap in the Middle East and potentially tremendous economic damage ensuing there is a lot of risk, somewhere between stagflation from the optimistic side to a greater depression on the pessimistic perspective
Well, in this remarkable system, here are ways to hedge that risk, at our fingertips.
All of the big tech companies slashing their workforces certainly isn’t helping the employment numbers.
No they aren’t, they are expanding.. there are so many new office buildings going up in Manhattan and as I said consumer spending is still red Hot
Not sure where you are gathering your information….
Big Tech Is Spending Billions to Not Employ People – Business Insider
Return to the office, to train your AI replacement.
And a monkey just flew out my butt. I named him Norman and sent him the the store for beer. Hope he don’t wreck the truck.
The fruits of the taco economy are shining through.
Agreed. Which is why I personally switched to a blend of using the social security snapshot (released monthly) that provides relatively accurate data on how many people are on the dole and leaving the labor force. I then subtract the kids in school (K-12) and assume most aren’t working, what you are left with is the working age population. Then fiddle with ADP numbers to try to get some real-time information versus the BLS garbage. None of this would be needed if we could just get real-time active social security numbers paying FICA.
Having said all that it’s not pretty. The demographic death spiral is accelerating and will continue to accelerate, nothing will stop that runaway freight train.
And after all that, I position for profits based on the projections of gaps, needs/wants, and other factors.
And I now have AI bots doing all the work for me so I can spend more time on Mishtalk.
Do worry, Trump, Walrus and the GOP will find a way to make things even worse.™
Not everyone pays into Social Security via FICA. A lot of government employees are on their own pension plans and don’t collect social security so you’d need more than that number to make a calculation.
Plus of course all the people working for cash that aren’t paying into anything of which there are plenty.
That’s actually the next stage. I’m having my AI bots find hard numbers from the most populous states and determine how many state, county, city employees exist. Should be available since it’s public info. I will then pull in actual K-12 enrollments not estimates.
Will use that data to feed into my investment strategy to optimize returns on spend.
that dont look like an expanding economy
Only at Dollar General, now known as Ten Dollar General. Next year it’ll be Twenty Dollar General.
But people are still buying the products.. Even when inflation hit the 9.2%peak in 2022 Consumer spending did not slow down
But retail spending numbers are never inflation adjusted, so it takes damn near a depression for “spending” (not obtaining) to actually go negative.
Back in 1850, the dollar store was where all of the rich people shopped.
Five and dime stores like Woolworths and Kresge’s had those exact prices until the mid 1930s so it was a lot later than 1850.
It looks like Trump’s turd economy that anyone with a functioning brain knew would be coming. Next up is a stock market crash (20%+ correction) at some point, I predict it will definitely happen before Trump’s term ends.
And here’s how I knew it would happen.
https://www.youtube.com/watch?v=rRndMiVIB-w
The malls are packed every weekend, high school and college kids can somehow afford $150 Nike Sneakers and $8.00 Starbucks Lattes along with $3.50 energy drinks.. How are people affording new cars, paying over $4,000 annual car insurance premiums plus tolls and congestion prices?
Here ya go, this will explain everything to you.
https://www.newyorkfed.org/medialibrary/interactives/householdcredit/data/pdf/HHDC_2026Q1
specifically the slide “Number of Accounts by Loan Type” clearly shows what I assume is your MO, demonstrating increased credit card debt utilization.
ED: HM to “Credit Limit and Balance for Credit Cards and HE Revolving” slide
No it looks like a booming economy
The boom that comes immediately after the “ka-“