

The jobs report was better than expected with an upward revision.
Understanding the Lead Chart
Note: If you have seen this explanation, please skip to down to the subtitle “Initial Thoughts” to continue reading.
Every January (typically), the BLS has annual revisions to nonfarm payrolls and household population employment. The BLS does not back revise the household charts.
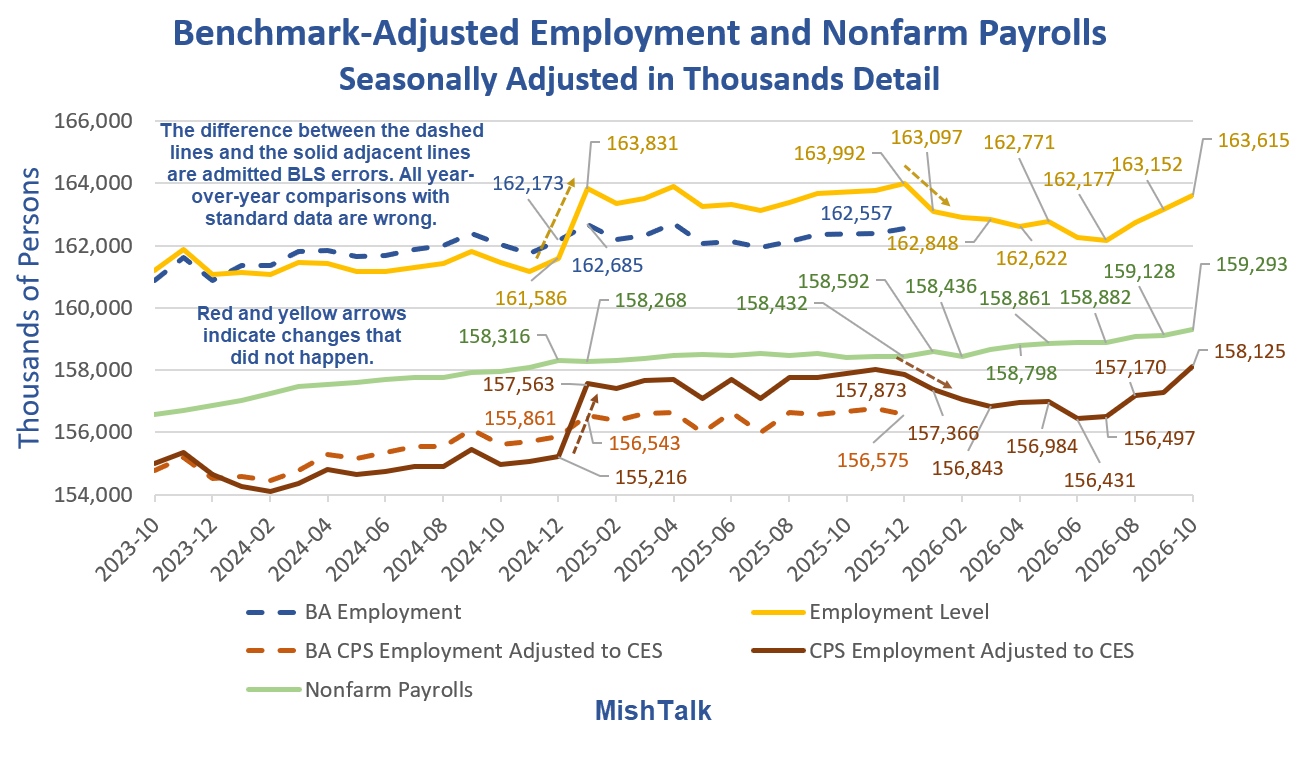
Because the BLS does not back revise, we see ridiculous numbers such as employment rising by over 2 million in a month (first yellow arrow).
To correct for the population adjustments, the BLS provides an adjustment series to normalize employment levels to match nonfarm payrolls. The BLS calls this “experimental” data but the regular posted data is admitted nonsense.
The experimental series is LNS16000000, “Employment Adjusted to CES Concepts“.
For 2024, the BLS admits that it undercounted employment by 2 million. Instead of parsing that out in the correct months, the BLS plowed the entire adjustment into January of 2025.
For 2025, the BLS admits that it overcounted employment by 1.4 million. Instead of parsing that out in the correct months, the BLS plowed the entire adjustment into January of 2026.
We did not suddenly add 2.245 million jobs in January of 2025, all US-Born. (Difference between the dashed blue line and the yellow line).
Moreover, there is no valid historical data on full vs parttime employment, on foreign born employment, and many other BLS data series. And there won’t be. There are no back adjustments key data components.
All posts on foreign-born employment, parttime employment, etc., suffer this flaw. All year-over-year (or December-to January) analysis you find on these stats is permanently flawed.
2025 Experimental Data
In April, the BLS released Experimental series accounting for January 2026 population control effects.
(Official CPS estimates for December 2025 and earlier months have not been revised, in accordance with usual practice.)
Experimental Series
In 2025, BLS produced new experimental time series measures to account for the size and timing of the large population changes reflected in the January 2025 population control adjustment.
The experimental series use the monthly time series (back to April 2020) available from the Census Bureau’s Vintage 2025 population estimates that form the basis of the January 2026 CPS population control adjustment.
The experimental series are smoother over time, as they do not show the annual effects of the population control adjustments that occur each January in the official series.
The experimental series adjusts data back to April 2020, the decennial census reference point.
Standard vs More Accurate Experimental Data
- Between December 2024 and January 2025, the standard data shows an increase of 2,245,000. The adjusted data shows a gain of 692,000.
- For December 2025, the employment level is a reported 163,992,000 vs the adjusted data at 162,557,000.
- By December 2025, the standard data employment level was overstated by 1,365,000. That did not happen in a single month. It was the result of cumulative months of bad data every month for a full year.
By standard practice, the BLS leaves the published data and charts in a known-to-be-wrong state.
Thus, all standard year-over-year household data comparisons are nonsense. Comparisons between January and December of the prior year are also invalid.
Initial Thoughts
I will continue to use what the BLS refers to as “experimental data” because the official household data is admitted nonsense.
This was a beat the street set of numbers except for a big divergence in two measures of unemployment, discussed below.
Here are the latest, undoubtedly wrong, and soon to be revised monthly job report details.
Monthly Job Report Details
- Nonfarm Payroll: +165,000 to 159,293,000 – Establishment Survey
- Civilian Non-institutional Population: +128,000 to 275,682,000
- Civilian Labor Force: +421,000 to 170,683,000 – Household Survey
- Participation Rate: +0.1 to 61.9% – Household Survey
- Employment: +463,000 to 163,615,000 – Household Survey
- Unemployment: -41,000 to 7,068,000 – Household Survey
- Baseline Unemployment Rate: -0.1 to 4.1% – Household Survey
- Not in Labor Force: -293,000 to 104,999,000 – Household Survey
- U-6 unemployment: +0.3 to 7.9% – Household Survey
Nonfarm Payrolls Change by Sector

Nonfarm Payrolls Change by Sector in Thousands
- Nonfarm Payrolls:+165
- Manufacturing: +19
- Construction: -3
- Leisure and Hospitality: +53
- Private Education and Health Care: +20
- Professional and Business Services: +70
- Information: -1
- Financial: +7
- Retail: +6
- Wholesale: -9
- Government: +6
Government Jobs Breakdown
- State: +8
- Federal: -1
- Local: -1
That was a good, and relatively balanced set of numbers.
Monthly Revisions
- The change in total nonfarm payroll employment for August was revised up by 53,000, from +133,000 to +186,000
- The change for September was revised up by 31,000, from +29,000 to +60,000.
- With these revisions, employment in August and September combined is 84,000 higher than previously reported.
Part-Time Jobs
- Involuntary Part-Time Work: +339,000 to 4,840,000
- Voluntary Part-Time Work: -149,000 to 22,664,000
- Total Full-Time Work: +717,000 to 135,090,000
- Total Part-Time Work: -242,000 to 28,504,000
- Multiple Job Holders: -101,000 to 8,805,000
The above numbers never total correctly due to the way the BLS makes seasonal adjustments. I list them as reported.
These numbers are highly unreliable for reasons noted above. Year-over-year comparisons are invalid, period. The BLS does not update these numbers in the experimental data.
Hours and Wages
- Average weekly hours of all private employees was flat at 34.4 hours.
- Average weekly hours of all private service-providing employees was flat at 33.3 hours.
- Average weekly hours of manufacturers was flat at to 40.5 hours.
This data is only as good as the data collection.
Hourly Earnings
This data is frequently revised. Here are the numbers as reported this month.
Average Hourly Earnings of All Nonfarm Workers rose $0.14 to $38.00. A year ago the average wage was $36.85. That’s a gain of 3.1%.
Average hourly earnings of Production and Nonsupervisory Workers rose $0.12 to $32.75. A year ago the average wage was $31.70. That’s a gain of 3.3%.
Accurately counted, these gains are not close to keeping up with inflation.
By accurate counting I mean factoring in homeowner’s insurance, property taxes, and tips on food. All three are excluded from the CPI. The BLS weights on food at home vs away are also wrong.
Unemployment Rate

Alternative Measures of Unemployment

The October numbers are interesting.
While the unemployment rate fell by a tenth of a point, there was a three-tenths rise in people who are discouraged or marginally-attached workers.
Table A-15 is where one can find a better approximation of what the unemployment rate really is.
- The official unemployment rate is 4.1 percent.
- U-6 is much higher at 7.9 percent.
Both numbers would be way higher still, were it not for millions dropping out of the labor force over the past few years.
Some of those dropping out of the labor force retired because they wanted to retire. Some dropped out over Covid fears and never returned. Still others took advantage of a strong stock market and retired early.
The rest is disability fraud, forced retirement (need for Social Security income), and discouraged workers.
The entire series is flawed by non-applied annual benchmark revisions.
The series is also flawed by poor response rates, deportations, illegals not answering phones, sampling errors and non-sampling errors.
Birth Death Model
Starting January 2014, I dropped the Birth/Death Model charts from this report.
The birth-death model pertains to the birth and death of corporations not individuals except by implication.
For those who follow the numbers, I retain this caution: Do not subtract the reported Birth-Death number from the reported headline number. That approach is statistically invalid.
Birth-Death Methodology Explained
I gave a detailed explanation of the model and why the usual calculation is wrong in my June 8, 2024 post How Much Did the BLS Birth-Death Adjustment Pad the May Jobs Report?
I repeat, do not subtract the birth-death number from the headline number.
Household Survey vs. Payroll Survey
- The payroll survey (sometimes called the establishment survey) is the headline jobs number. It is based on employer reporting.
- The household survey is a phone survey conducted by the BLS. It measures employment, unemployment and other factors.
If you work one hour, you are employed. If you don’t have a job and fail to look for one, you are not considered unemployed, rather, you drop out of the labor force.
Foreign-Born Employment
The numbers in my charts are seasonally adjusted. Foreign born employment is not adjusted, compounding comparison errors.
And we have no BLS revised data for foreign born employment. So, all such foreign and US-born comparisons with BLS data remain nonsense.
A second major problem with foreign-born employment is the BLS makes no distinction between US citizens who were foreign born and genuine foreign workers.
Comments on BLS Data
The BLS monthly data is garbage.I do the best with BLS data that I can, or anyone can.
The quarterly QCEW and Business Employment (BED)reports represent a 96 percent sample. But those reports lag by about 5 months.
The Birth-Death model that feeds the monthly jobs report is bogus. It has been screwed up since Covid, first underreporting jobs then overreporting them.
QCEW and BED data show more jobs are now being lost in closing businesses than gained in new businesses.
Annual revisions have been lower for three consecutive years.
However, there are hints from QCEW that the bulk of negative annual revisions may finally be in the past.
Final Thoughts – Do I Believe These Numbers?
In one word no, at least the Household numbers. The economy did not add 717,000 full-time workers.
One has to wonder how messed up the Household phone survey is due to response rates from illegal aliens.
Are illegal immigrants answering these surveys? If not, then other individuals are overweighted.
A decline in the unemployment rate coupled with a much bigger rise in the U-6 unemployment rate also adds to the mistrust.
The establishment data is also suspect, but less so. Are minority firms or firms dependent on immigrants answering these surveys?
If not, then survey responses from firms not dependent on immigrants are overweight, boosting the numbers.
Related Posts
October 28, 2026: The Fed Holds Interest Rates Steady with Two Dissents for a Hike
As expected, the Fed held rates steady. But a dissent by Lisa Cook is sure to anger Trump.
October 28, 2026: The September Advance Trade Balance in Goods Is Negative 134.9 Billion
The Econoday consensus was an improvement to $129.0 billion, a substantial miss. One silly soul predicted -88.0 billion. I wonder where that came from.
October 29, 2026: Real GDP Growth Accelerates to 3.4 Percent in the Third Quarter
Private domestic sales suggest economic overheating.
This jobs report will increase the likelihood of a Fed rate hike in December.


Lead times for printed circuit boards are being pushed out due to demand of AI data center build out. That’s great news for PCB manufacturers and employees, but those delays will idle designers of boards while the backlog of boards unwinds. Some companies looking to design and build non-data center boards may cancel or delay projects because prices are higher to compete for priority (bidding war) or they can’t afford to idle designers.
You’re probably right but if the AI bubble implodes all hell is going to break loose on bond defaults and the subsequent chain reaction. Of course, if the AI bubble keeps going, inflation will blow out of control. Either way, the Fed is guaranteed to make things worse.
Then you have the Trump factor…more wars for Israel?
Do worry, Trump, Walrus, GOP, and democrats will find a way to make things even worse.™
Trump just named Stephen Miller his Chief of Staff
Shuffling waiters and maids on the Trumptanic won’t change anything. They are gonna drown in a deep BLUE sea.
Mish, are your downloads off? I see that:
Private Education and Health Services inc. +53k, not +20k
Leisure and Hospitality dec. -13k, not inc. +53k
https://www.bls.gov/news.release/pdf/empsit.pdf?ref=n3_sticker
Net energy costs (mostly products) will likely stay inflationary for next ~6 months.
As for inflation,
1st Derivative near term effect:
MoM Chinese refined products market is down in Oct, now Nov about 500k-600k bpd in exports to other Asian markets.
Energy’s 2nd and 3rd derivative effects are now adding to inflation problems. Current example quoted:
2nd derivative effects
3rd derivative effect:POSITIONED FOR A STRONG 2027
Phillips 66 said it had secured more than 40 time-charter vessels before the Iran conflict, covering about 40% of its asset-based shipping needs.
Valero, PBF, Marathon and Canada’s Suncor (SU.TO), opens new tab
also secured chartered fleets before the war began, insulating them from the surge in prices.
Wider differentials are expected to continue to lend strength next year as well, some industry executives said.
Why don’t they use information from the payrolls tax statements from employers?
Explained a dozen times, and the one of the reasons is patently stupid.
For security reasons, the BLS does not have access to the data.
Yes, I am serious.
Had discussion with BLS on this and that is what they told me.
The other reason is some people are paid quarterly or monthly so the BLS uses its stupid Birth-death model to estimate.
Thank you very much for taking the time to answer.
I realize I have not ended measuring the huge incompetence -or bad faith, or both- of governments. Of course there are tools to strip the data from sensitive information.
The same for adjusting for quarterly or monthly payments.
It seems they prefer inaccuracy, so they can manipulate the results, publish whatever they wish, and later claim that the model malfunctioned.
With the actual design, it is impossible to produce acceptably accurate results.
great points. i enjoyed the shadow stats guy when he was free. they manipulate them all. raygun really started that big time grifting maneuver in his days in power.
Well, I can hear the rate hike a coming. Not sure why anyone would celebrate this news since it locks in a hike whether it’s real or not.
There will be no hike. Expect a pause in December as the Fed must rescue Wall Street specualtors. I don’t care what CME Fed Watch says. AI won’t be able to add to GDP anymore and it was the only thing holding the economy up.
The Fed wants inflation and if it can’t get it by bogus AI economics it will point a fire-hose of cheap money at the markets.
I expect January or Feb 2027 will be rate cuts.
The only thing holding economy up? No it’s very strong consumer spending. People are still buying $50,000 new cars and $25,000 used cars for example
I dunno, seems like the Fed was hungry enough to have dissents even last time before an election. I think that seals in a hike and the markets seem to agree. Would be interested to hear what Mish thinks.
Rate Hike 80 Percent
You should visit WolfStreet’s analysis if you want to know about AI. He wrote a great piece about how the 13 biggest AI companies currently have a combined $1.1 trillion in cash ready for spending.
If you don’t like AI, don’t invest in the companies’ stock or debt; I don’t want any of that myself. But if you’re talking about real impacts on upcoming GDP, $1.1T in spending is going to last awhile
If they have all of that cash, why have they issued over $500 billion in debt?
Basic business modeling for expanding businesses: use others’ money to expand.
Issue debt when it’s cheap and then use the cash whenever you need it.
i saw that analysis. seemed like bullshit. wolfstreet is decent but that guy is a real bootlicker for governments and doesn’t let you disagree with him. smells like the old iron curtain to me. i experienced that when she came tumbling down. so many bootlickers over in mother russia.
But also, my guess is you’re just spouting off about rate cuts vs. hikes. If you really believe cuts are coming in early 2027, you should be making big bets because the rest of the market will give you great odds on that ‘knowledge’
Rate Hike about 80% IMO
And the moon is made of green cheese !