
The technical picture is very clear, yet unresolved. There’s also a debate over reserves and fundamentals.
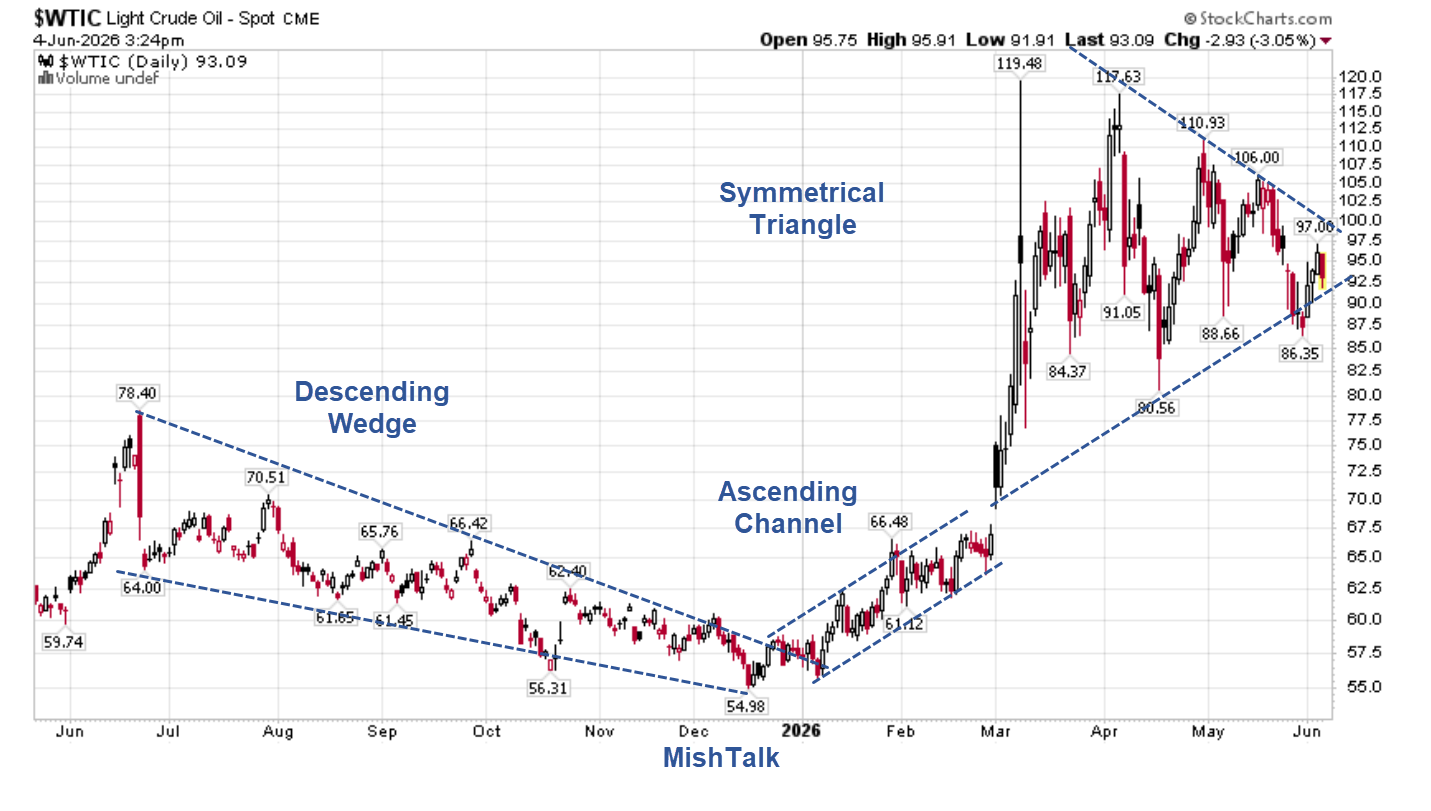
The Technical Picture Brent
- Declining Wedge: Expected Direction Up
- Ascending Channel: Expected Direction Up
- Symmetrical Triangle: Indecision
A symmetrical triangle is a popular technical analysis chart pattern that forms when an asset’s price consolidates, creating a series of lower highs and higher lows. It indicates market indecision, where buyers and sellers are in equilibrium until a decisive breakout signals the next major price trend.
“Oil prices decline. If WTI breaks the $90 recent support, it is likely to fall like a rock.”
Technically speaking that is correct although I like fatter crayons, say $86.
What Lacalle did not say is that a breakout above $100 implies the opposite.
The Technical Picture Brent

The Brent picture is similar, but not quite as symmetrical. Everything looks like indecision.
Crude Drawdown?
Anas Alhajji says there is no crude drawdown. Exxon, Chevron, and official measures say there is.
Exxon Warns of $150 Crude. Here are the Supporting Charts
Global observed crude levels are at record low levels. Implications are ominous.

On June 1, 2026, I commented Exxon Warns of $150 Crude. Here are the Supporting Charts
Global Crude Inventory Chart Notes
- Data is from JODI (through March 2026)
- April is based on the May IEA Oil Market Report
- May is preliminary estimate based on continued aggressive draw pace and industry reports (Exxon, etc.)
The JODI data contains 119 countries, some minor countries not reporting.
I downloaded the data, converted to Excel format and totaled the inventory reports by month to produce the above chart.
I asked Grok what to make of the difference of opinion.
Grok on the Divergence
This is classic oil-market data war. Both of you are using credible sources, but disagree on what is being measured and where.
- Data source & methodology gap
- Your side (Exxon/IEA/JODI): official government-reported “observed” inventories. These tend to lag, can be revised, and often emphasize OECD or “visible” stocks.
- Anas’s side (Kpler/EOA): independent tanker-tracking, satellite, and port data — more real-time, more “physical molecule” focused. Kpler is widely respected for spotting floating storage, rerouting, and unreported builds.
→ Kpler is currently saying the commercial barrel count is not in free-fall; it’s actually built a bit.- Commercial vs. total / SPR
Exxon explicitly called out commercial inventories running down. Anas’s chart is also commercial — and it’s up. That’s the most direct contradiction. If Kpler is right, Exxon’s warning looks premature or regionally focused rather than globally apocalyptic.- The China wildcard + location, location, location
A 6 mb/d demand drop from China is enormous — it’s like removing a major importer overnight. That alone can flatten global inventory draws even with Hormuz disruptions. Plus, barrels stranded in the Gulf (Iraq, etc.) don’t help refiners in Europe or Asia who are paying up for rerouted or alternative crudes. Aggregate global numbers can look “fine” while regional tightness (and freight costs) still push prices higher.- Timing
Your post was June 1. Anas’s chart reflects “now” (June 4). The April/May draws you cite may already be reversing as pre-builds unwind and China’s lower demand shows up in the numbers.Alhajji has a strong case that the headline “global inventories are crashing” narrative is overstated or at least premature. The Kpler picture suggests the market has more cushion (or at least more hidden supply/demand rebalancing) than the IEA/Exxon framing implies.
That helps explain why we haven’t seen the vertical spike to $150 yet despite the geopolitical shock.That said, your post isn’t wrong — it faithfully reports what Exxon (a company with massive skin in the game) and the IEA are signaling, plus the JODI/IEA draw numbers that were real through April.
Physical tightness in the right basins, product inventories, and the sheer cost of rerouting around Hormuz can still create localized squeezes and volatility even if the global commercial total is flat-ish.Oil markets love these data fights because no single source is perfect.
Right now the Kpler commercial inventory chart is the strongest evidence against an imminent $150 blow-off top. If it holds up over the next few weeks, the “mirage” label sticks and the near-term price risk is lower than Exxon’s model suggests.
We’ll know soon enough — inventories are reported weekly/monthly, and the physical flows don’t lie forever. Your charts nailed the bullish risk case; Anas just dropped the counter-chart that says “not so fast.” Classic Mish vs. energy-data-skeptic debate. I’m watching the next IEA/Kpler updates with interest.
What Else Is in Play?
That’s a key question. The drawdown is big crowd can be right, but if there is a Mideast deal between Trump and Iran that opens the strait, the price of oil can rise significantly anyway.
My unpopular take is there will be a deal, on terms favorable to Iran (the whole world actually, excluding Benjamin Netanyahu and the US warmongers).
Alternatively, Alhajji could be right, but if a major escalation breaks out, oil prices would surge.
Thus a breakout in either direction does not necessarily resolve the question as to which view is correct.
No Playbook Theory
Abdulaziz bin Salman Al Saud Saudi Minister of Energy
In the midst, not probably but definitely, of the biggest energy crisis the world has ever seen, I haven’t uttered a single word. And I intend to maintain that record simply because I believe that being silent is a type of talking.
For me to be silent is an admission, a humble admission of the fact that I don’t know what will happen, not tomorrow but even in half an hour time. So, if you don’t know what will be happening, you might as well say, I don’t know it.
There are so many moving parts, there are so many unknowns, there are things that you think are a reality but then you wake up in the next morning and the reality is no longer a reality. It’s a pipe dream or it’s an imagined hope of wishful thinking. If you don’t know it, be silent.
China’s Storage Levels
Part of the uncertainty is le level of China’s reserves.
I asked Grok “Does anyone really know China’s storage levels?”
No, no one outside China’s inner circle has precise, verified numbers on its total oil storage levels. China treats detailed inventory data as a national security matter and does not publish comprehensive, timely official figures like the US (EIA weekly) or IEA/OECD countries.
Why the opacity?
- Official policy: Total stocks (commercial + strategic) are not disclosed. The government reports some high-level import/refining data via Customs and NBS, but not storage movements. Analysts call this a “state secret.” jkempenergy.com
- Estimates rely on proxies: Implied builds from imports minus refinery runs + exports + demand, plus satellite imagery, tanker tracking, port data, and partial local reports (e.g., Shandong teapot refineries).
Independent firms like Kpler, Vortexa, Kayrros, and agencies like the EIA provide the most credible estimates:
- Total (strategic/govt + commercial): ~1.4 billion barrels as of late 2025/early 2026 (EIA). This includes ~360 mb government-held SPR-like and ~1 billion commercial (refineries, tanks). eia.gov
- Onshore commercial crude: Peaked near 1.22–1.25 billion barrels in early May 2026, then started drawing ~1 mb/d as imports collapsed. reuters.com
- Builds were aggressive in 2025 (~1.1 mb/d average addition) and continued into early 2026 pre-disruption, using cheap Russian/Iranian barrels. jkempenergy.com
These are estimates, not audited counts. Discrepancies exist between sources (e.g., Kpler vs. Vortexa on exact draw rates or floating storage), and underground caverns or unreported tanks add further uncertainty.
Recent context (Hormuz disruptions)
China pre-built stocks heavily, then slashed seaborne imports to decade lows (~6.5–7 mb/d in May) while drawing commercial inventories to cushion refiners. This has absorbed some global tightness without panic. Even here, trackers differ slightly on the pace of the draw. reuters.com
Bottom line: Kpler/Vortexa/EIA give us a good enough picture for market analysis (China has a massive buffer, equivalent to 3+ months of imports at normal rates), but it’s not exact or real-time like Western data. This opacity fuels debates like the one between your Exxon/JODI view and Anas’s Kpler charts — China’s “hidden” cushion is a big reason global aggregates can look misleading. We’ll get clearer signals only indirectly, via sustained import behavior and price action.
The technical charts are an excellent embodiment of this uncertainty.
I still maintain this view: Trump still has the same three options he has had since the ceasefire started on April 7, 2026.
Trump’s Three Options
- Military Escalation
- Wait Iran Out
- Agree to a Deal Acceptable to Iran
Military Escalation Option Is Flawed
A military operation to remove Iran’s nuclear material could take years with no guarantee of success. Indeed, I would expect this to fail just like we failed in Afghanistan and Vietnam.
The US production of defense systems is running low. The US and the Mideast is defending against $30,000 drones with much more expensive options that are in short supply.
Importantly, it is Iran, not the US, with huge escalation threats. Iran, if attacked, could go after desalinization plants in the region. Literally, the entire nation of Saudi Arabia would have to evacuate in days if its desalinization plants were hit.
Trump seems resigned to the above facts, which is why a ceasefire is in place.
Trump has learned nothing from history. Iran has much higher tolerance for pain than Trump expected.
Never before has a blockade worked. It inevitably increases the resolve of those being attacked. In this case, Trump and Israel killed the Iranian leadership who were willing to negotiate.
Waiting Iran out is not an option because Iran has chosen to wait the US out. And Iran has a much higher tolerance for pain.
Agree to a Deal Acceptable to Iran
When you throw away every option that doesn’t work, you are left with options that will work. That is option three, no matter how distasteful.
It is Trump who is desperate for a deal, not Iran.
For discussion, please see Frustrated Trump Ups Terms for a Deal with Iran. What’s Going On?
Many see this as a sign of no deal. I suggest something else.
Also see Hello. We Are Again Discussing the Terms of Trump’s Surrender to Iran
It’s only a matter of time before Trump waves the white flag.
Those are my stated opinions.
Regardless, there are many technical and fundamental reasons for oil to go in either direction from here.
But I don’t know and nor does anyone else.


There will be no agreement. Trump will tell his rubes that something is more pressing and just walk away. Then blame it on Obama or Biden. His approval ratings will jump because he ended the war.
I don’t like simple TA. EW accounts for more complex, fractal patterns. In this case, that’s a classic running triangle (3-3-3-3-3) that precedes a final impulse wave. That is, there are higher prices coming, in a big way.
Oil price continues to decline. Would be interesting to know how the price is being manipulated. Probably some combination of release of more oil from SPR, propaganda printed in the mainstream media, and cooperation of oil executives.
I’m seeing prices over $4 again in E. Central Florida.
Interesting take from Anas Al-Hajji. His takes have been great in recent months, so this is a bit of a surprise.
· The price of oil peaked in mid-2008 at $147/barrel for WTI.
· Inflation (according to Google) since then has been 55%.
· The means in current dollars the mid-2008 peak would be $228/barrel.
· We are nowhere near that price at ~$91/barrel presently.
What was the price 60 days before it hit $147/barrel?
I was a bike commuter when I worked in the city, those were the days of gas shortages and rationing. I saved a ton of money and got good exercise. Americans are notoriously lazy and seem to like massive pickup trucks that eat gas. Big fat American could benefit from saddling up.
Those that do ride bikes these days seem to buy e-bikes, so they don’t have to do any work. Obesity will be the death of many Americans.
Amen. Americans are too lazy to move around under their own power, so any energy disruption is serious. The ebike riders would probably stroke out if they had to pedal.
Do the number of Kepler include the oil in the middle east storage? Because if they counted also that oil obviously it went up because the fill up every single tank/vessel and barge before closing the wells. But this oil is not available to the market….
Good Question.
I don’t know.
Yes. Kpler’s storage data includes all on-land and at-sea oil storage, including the middle east and China. About the only oil it does not count is the 3-4 billion barrels of oil in pipelines all over the world because that oil is operational line fill and unavailable.
So in a nutshell they have included a lot of oil that can not (at least at the moment) reach the market….
I was thinking the same thing. Oil in storage isn’t the same thing a diesel at the pump. Having record amounts in storage and zero diesel at the pump can both be true.
Yes. Oil stuck in the Middle East or stored in China is not available for use.
Kpler provides good data. However, like all statistics, people will massage them to reach the conclusions they desire.
What if folks just stopped driving like it was 2020. A deep recession with mass unemployment cures high prices for everything.
Unfortunately, that is the direction the global economy is heading towards. Strange that markets seem blissfully unaware.
Global? There will be hamlets of energy and food and fertilizer sufficiency out there.
Got an exit strategy?
Markets know but they just don’t care. All that money has to go somewhere and with real estate and crypto in the dumper it’s going into Stonks (at least for now).
Stocks are dropping big today, especially in the tech sector
Those $30,000 drones are getting cheaper to make every year. The cost to defend against those increases every year.
That E-3 destroyed was irreplaceable.
Let’s inject the politics which matter most: domestic!
What if Sen. Graham and Blumenthal tell Trump
a) the new Congress will impeach you and
b) 2/3 of the Senate hate you because…you’re you. Do what we say or else.
Can Trump realistically:
1) punk Bibi in Lebanon
2) hand over $12B cash to Tehran
3) recognize Iran/Oman sovereignty over Hormuz?
My (reasonably hedged) bet is no and I’m long the oom calls to show for it. Booyah!
95 days and the gas stations are all open. Smells like either direction to keep the pumps open no matter what from the White House or they sold a lot more electric vehicles that they are willing to admit.
The US will not run out of gasoline. Though many other countries will.
Our gas will merely become more expensive.
As a peak oiler, we know the world wont run out of gasoline. Just a matter of price as you said. However, with 50k products made with oil, important ones like jet fuel and diesel, and this period the last few weeks where US oil products LEFT the US cause the world needed the products right now, gasoline may be the least of our worries.
One of those 50,000 products from oil is an important one, gasoline, its availability will be affected by crude supply. During the Arab crude embargo, lines were long at gas stations.
Oh, no doubt. Gasoline is important, but people have several alternatives (bikes, public trans, carpooling, living less, etc) You cant carpool a plane or a semi, and you cant wrap food cleanly without plastic. I myself am looking forward to dumping my car in a few years.
I downgraded to a shitwagon years ago, and it gets driven twice a month for groceries. I do not miss the road game.
Canada is due north and connected to the US by pipeline. Supply is not an issue for the US but price is. Canada is going to build a pipeline to the west coast and start exporting to Asia but that will take years. Canada had no reason to make that investment in the past now with Trump threatening Canada’s economy, diversification of markets is the watch word for every Canadian politician and with government if some is good more is better.
I don’t think this diversification will stop when Trump is gone. It is like Trump has woken the world up and they have discovered that the US is not to be trusted and it is not as powerful as everyone thought.
The world sees that there is nothing to stop the US from voting in another lunatic in 2028. It seems that there are left leaning lunatics and right leaning lunatics that run for president and those are the choices.
Canada expanded their TMX pipeline to carry 890,000 barrels of oil to the BC coast in 2024 (up from 300,000 bbl). There are plans to increase that capacity to 1.1 mb over the next few years. Countries like Korea have already committed to buy some of that oil.
There are also proposals for a brand new oil pipeline, but that is unlikely to be ready for another decade. Canada wants to diversify exports to other countries, but the timelines are lengthy.
In the meantime there will be the Prairie Connector pipeline project from Alberta to Wyoming which will increase Canadian exports to the US by another 550,000 barrels per day by 2030. Which will add to the 4 million barrels of oil that Canada already sends to the US.
Anas is only looking at commercial crude inventories and he is comparing them to the beginning of the year. Inventories built up in the first two months of the year, which is why oil dropped to $60. That build up has been reversed since then and the drawdowns are accelerating. He is also ignoring over 200 mb of sanctioned oil from Russia, Venezuela, and Iran that have been used up, as well as the SPR draws of over 200 mb so far.
The IEA report for May says observed global oil inventories declined by 129 million barrels in March, and 146 million barrels in April. The May global numbers are not out yet but should be an even larger draw down than the previous two months.
For example, the US made some draw down records in the month of May.
US only numbers for the weeks in May:
Week ended May 29: commercial draw of 8.15 mb, SPR draw of 8 mb
Week ended May 22: com 0.4 draw, SPR 9.1 mb draw
Week ended May 15: com 7.9 mb draw, SPR 9.8 mb draw (record)
Week ended May 8: com 1.7 mb draw, SPR 8.6 mb draw
The world is definitely drawing down available reserves. As Mish pointed out, China has been a big help so far in delaying the coming catastrophe by reducing their imports from roughly 11 mbpd in March to 9 in April, 7 in May, and 5 in June. At some point this will turn around because they do not want to draw down their own reserves too much.
I find it odd that there are folks out there who are trying hard to make this look like much ado about nothing. I guess it helps them score views and listens.
But every additional day that Hormuz remains severely restricted means the world continues to draw down our remaining reserves. I side with the pessimists who say that severe shortages are coming in the very near future and that prices will have to jump significantly to destroy enough demand to balance the limited supply.
Thank you for this excellent write up on the issue, I said above Anas has been good lately, this post of yours saves me inordinate time coming up with what you did myself (and it would not likely have been as good). Kudos
You’re welcome. I used to follow Anas more closely, but I have been disappointed in his posts over the last few months. He seems to want to present info in a way that makes himself stand out from the crowd, but that often results in strange statements that don’t give a proper picture.
I find Doomberg the same.
Also the SPR has a very limited number of drawdowns due to the repeated fluid stress/erosion on the salt caves.
Yep.
That the US govt is having to draw down the Strategic Reserve to keep the price at 95-100… is a pretty good indicator that a meaningful shortage is in the offing. If what has been said about the Strait of Hormuz forever is right, the world is short 15-18% of its oil. (and fertilizer!) The buffers should wear thin pretty soon.
I think everything in this article is spot on for the near term, but current price stability is made possible via storage drawdowns compensating for Hormuz closure and reduced production from war damage to facilities. When global drawdowns are terminated for national security issues, reduced production and refining capacity will likely have greater influence pushing prices up in my opinion. I have seen estimates as long as 3 to 5 years to repair some of the damage.
The US has not been able to export more crude due to increase production; it has been primarily from SPR withdrawals. When that tank is empty, US price reality will set in. Hard to predict the timing, but it can probably be framed in months and not years. The most likely quick fix would be pipeline construction from Canada to a pipeline terminal in the US for distribution where needed. Just my thoughts.
frankly canada should charge a export tax equal to the stupid tariffs.
Option 3 is more than distasteful – it is bitter; and Trump, and the US in general, will not choose to swallow a bitter pill until it is the least painful option. That means more military losses for the US, and the loss of Gulf allies – before the US gives up.
Also, for as long as I can remember, the neo-con/Zionists in the US ALWAYS get their way, and they seem to want more war. So that’s what we will get – unless there’s truth to the rumours that Iran already has the bomb – in that case, all bets are off.
What irony. If Iran has the bomb, that would actually effectuate peace quicker than anything else.
Some say that Iran communicated through Pakistan that, unless the Zionist Axis desists and ceases their war of aggression, it’ll detonate a nuclear device on its soil as a warning.
The ultimate source for these rumors, Pepe Escobar, has a long and storied track record of BS And fantasy.
Both Pepe and Larry C Johnson scooped this out. But I agree that it may have been planted to give the Zionist Axis pause.
War anywhere, any time, for any reason is good because MIC.
Then they need to say so, so this thing can end.
As Churchill said, “You can always count on the Americans to do the right thing, after they’ve tried everything else.”
That was as a phlegmatic way of calling Usonians stupid as only a Britt could.
British strategy since 1917 has been to get Americans to do their fighting for them.
And the Usonians, proving Churchill right, obliged to cull their young and spill their blood for the empire.
Neither Trump nor the US are in charge here. As you state, the neocons and Zionists always get their way, and they are foaming at the mouth for more war.
There’s no doubt that if a deal is signed it moves to favor Iran. However, I have a hard time believing a deal, even if the 60 day MOU, could be had this month.
I say this because the issue of Lebanon and Gaza are unresolved, and for some unfinished, and doesn’t look to be ending anytime soon.
If a deal isn’t had this month we shall see if global crude inventory piles are what Alhajji said, actually building, or been vaporized into a black hole.
I tend to believe the latter and sometime in July prices start to shoot for the moon.
I would encourage you to look at and consider refined products (gas, distilaltes/diesel, heating oil, etc). as IMO that situation has “bad for longer” more backed in the cake. Significant Global refining capacity is down and not coming back into 2027 and on. Not a “Strait that can get opened” type thing.
We don’t have the excess capacity for making up Global Outages. We have pulled b/tn 16% to 32% mil barrels TOTAL 5-YR AVERAGE MONTHLY PRODUCTION of diesel from exports every month this year. OUR SYSYEM HAS NO WHERE NEAR THAT MUCH SURPLUS CAPACITY – AND THAT’S JUST DIESEL!!
Will Sr Moment Donald cut back fuel exports (by tariffs or fiat) as we go through 20-Days/Inventory (likely next 30 TO 45 DAYS)?Since it won’t rebalance soon if we don’t get proactive on exports rationing by price could get quite painful. Global refining and slow rebalancing will make fuel (potentially – but I think so) more painful than oil. And painful to the mkts too.
Excellent article, Mish. I had no idea that the amount of oil on the seas and in reserves was so open to dispute. I disagree about Trump doing a “deal” anytime soon. The Israel lobby and the neocons will fight it tooth and nail. All Israel has to do to scuttle a deal is dial up the murdering. Plus, the US is thoroughly untrustworthy, so Iran will continue to demand things (unfreezing assets and lifting sanctions) upfront. It’s not in the American nature to do that. We’re the scorpion on the frog’s back. We can’t not backstab other countries.
My forecast for oil is variable clowness with Trump tearful showers and gusty bloviating; humid farts; heavier downpours of lies, obfuscation and misdirection leading to global shortages.
I am expecting gusting profits with periodic opportunities for cash positioning.
And don’t forget we are entering hurricane season which may disrupt offshore oil production and refining. Let’s hope Trump has his sharpie ready to give us his forecast path.
funny pic.
https://i.redd.it/wr9wxpmxna5h1.jpeg
Do worry, Trump & Walrus will find a way to make things even worse.™
The world will have to buy more from the US. Every other country that can still supply the world market (such as Canada) will benefit from the higher prices because the supply is so constrained.
Basically, my contrarian view is that Trump is actually in no hurry to have that Strait opened because U.S. petroleum & gas companies stand to benefit tremendously from this.
Prices will eventually rise to ‘what the market will bear’. In 2008, oil prices went to $147 per barrel. That’s the historical precedent. The U.S. dollar is worth much less in 2026 than in 2008. My guess on how high? Around $200 if not more.
That’ll be an election winner….
Granted I’m a cynic, but I think whoever wins the elections this fall doesn’t actually matter. The Uniparty always wins.
The US producers are not increasing their production. Higher US exports will raise the price of WTI meaning more pain at the pump.
In the scenario you outlined, where is the US consumer? Under Trump’s boot is my guess.
He did say he didn’t care about us.
I think if China sold their supply it wouldn’t be cheap.
oil? its coal Trump Offers Funds for First New U.S. Coal Plants in 13 Years
The president announced a total of $700 million in federal money to reinvigorate the domestic coal industry, which has been in decline for decades.
US coal production has fallen by over 50% since 2008. Coal has been replaced by much cheaper and cleaner natural gas production which dramatically increased because of the fracking revolution. Fortunately, the US still has a lot of cheap natural gas. Which means coal production will continue to decline unless you provide massive subsidies to keep it competitive with NG.
Visit your local coal miner recruitment office today.
What a waste of time that was……
The outlook is very good. No one is making any more and they are discovering less and less in smaller and smaller quantities. Maybe in Siberia…
The admin places the blame for price….
Energy Secretary Chris Wright: “Democratic green energy policies have driven up energy prices far more than a conflict in Iran”
Amusing. wasn’t Oil $60 in January?
Did Trump embrace green energy causing the price rise or was it war?