

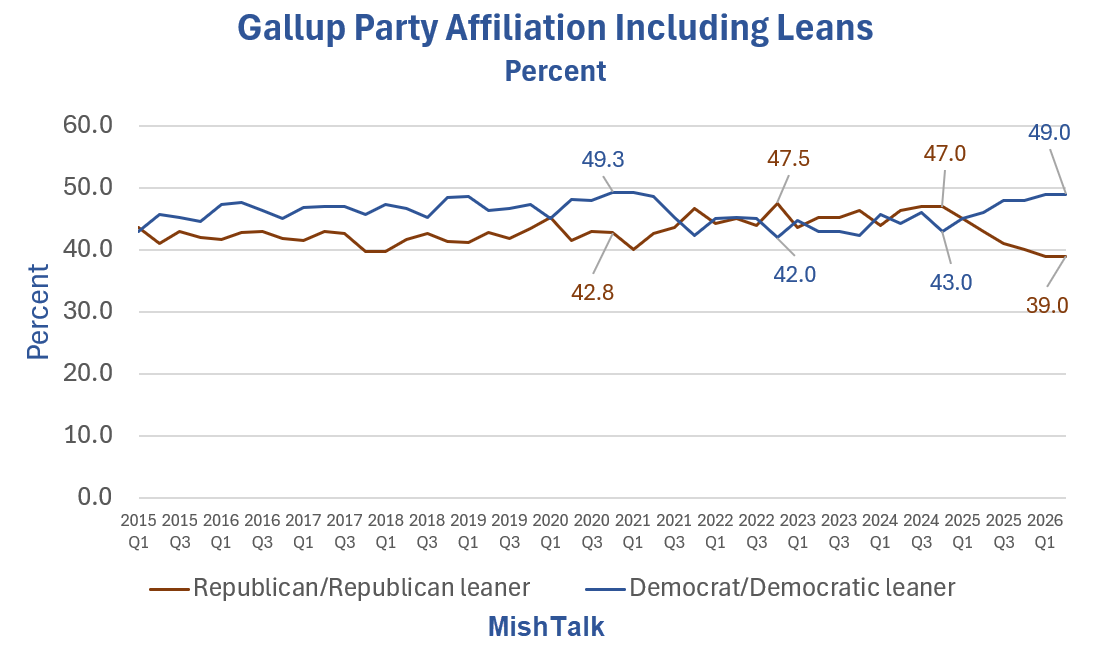
Let’s review what this means historically.
The charts in this post, except where noted are from a data download of Gallup’s Quarterly Party Affiliation Survey from 2015 Q1 through 2026 Q2.
Lead Chart Question
In politics, as of today, do you consider yourself a Republican, a Democrat or an independent? (As of today, do you lean more to the Democratic Party or the Republican Party?) Shown are % party identifiers + leaners.
Gallup Party affiliation 2015-2026

Affiliation Poll Question
In politics, as of today, do you consider yourself a Republican, a Democrat or an independent?
From the above data I calculated democrat minus republican spreads.
Gallup Party affiliation Spreads

Current Party Affiliation Spreads
- Including Leans: 10.0 percent
- Ignoring Leans: 6.0 percent
Both spreads are the largest since 2015.
National Election Results & Polling Analysis Tracker
| Year | Dem Actual (%) | Rep Actual (%) | Margin Actual | Current Spread Including Leans | Error Direction |
|---|---|---|---|---|---|
| 2016 | 48.2% | 46.1% | D+2.1 | D+3.2 (2016 Q4) | R+1.1 (Poll was 1.1% too Dem) |
| 2018 | 53.4% | 45.0% | D+8.4 | D+7.2 (2018 Q4) | D+1.2 (Poll was 1.2% too Rep) |
| 2020 | 51.3% | 46.9% | D+4.5 | D+6.5 (2020 Q4) | R+2.0 (Poll was 2.0% too Dem) |
| 2022 | 47.8% | 50.6% | R+2.8 | R+5.5 (2022 Q4) | D+2.7 (Poll was 2.7% too Rep) |
| 2024 | 48.3% | 49.8% | R+1.5 | R+4.0 (2024 Q4) | D+2.5 (Poll was 2.5% too Rep) |
| 2026 | TBD | TBD | TBD | D+10.0 (2026 Q2) | TBD |
Error Direction Explanation
- R+ indicates the poll over-estimated Democrats (the actual result was more Republican than the poll).
- D+ indicates the poll over-estimated Republicans (the actual result was more Democratic than the poll).
The largest directional errors since 2015 were in 2022 where Republicans were 2.7 percentage points too high, and 2024 where Republicans were 2.5 percentage points too high.
The largest directional error for Democrats was in 2020 when the spread was 2.0 percentage point too high.
Even if one doubles that Democrat directional error, you are looking at a +6.0 national percentage point spread favoring Democrats.
This assumes the polls do not change before the election. Let’s use Q2 polls for all years.
Historical Q2 Polling Baseline vs. Actual Election Results
| Year | Dem Actual (%) | Rep Actual (%) | Margin Actual | Q2 Spread Including Leans (From Your Image) | Polling Error |
|---|---|---|---|---|---|
| 2016 | 48.2% | 46.1% | D+2.1 | D+4.8 (Row 7: 47.6% – 42.8%) | R+2.7 (Poll was 2.7% too Dem) |
| 2018 | 53.4% | 45.0% | D+8.4 | D+5.0 (Row 15: 46.7% – 41.7%) | D+3.4 (Poll was 3.4% too Rep) |
| 2020 | 51.3% | 46.9% | D+4.5 | D+6.6 (Row 23: 48.2% – 41.6%) | R+2.1 (Poll was 2.1% too Dem) |
| 2022 | 47.8% | 50.6% | R+2.8 | D+0.3 (Row 31: 45.3% – 45.0%) | R+3.1 (Poll was 3.1% too Dem) |
| 2024 | 48.3% | 49.8% | R+1.5 | R+2.0 (Row 39: 44.3% – 46.3%) | D+0.5 (Poll was 0.5% too Rep) |
| 2026 | TBD | TBD | TBD | D+10.0 (Row 47: 49.0% – 39.0%) | TBD |
Largest Errors Using Q2 Data
- 2018 Midterms: 3.4 percent too Republican when Republicans held the White House
- 2022 Midterms: 3.1 percent too Democrat when Democrats held the White House.
Political Context
- In both Midterms the Q2 results overcounted the incumbent party
- In 2018 Q4 the poll estimated a D+7.2 environment, but the actual result was a D+8.4 “blue wave”.
- In 2022 Q4, Democrats held the White House. The poll estimated a heavy R+5.5 wave, but the actual result was a much narrower R+2.8, meaning the historical midterm penalty for Democrats wasn’t as severe as the polls anticipated.
Expect a Blue Wave

Expect another Blue Wave in November. The incumbent party rates to get hurt badly even in a normal cycle.
This is not a normal cycle. Trump is one of the most unpopular presidents in history.
Gerrymandering will save some Republican net House seats but Dilution always weakens something, somewhere else.
A Blue Wave on Polymarket only requires winning the House and a pickup of two Senate seats. I believe this is a given.
Right now, I expect Democrats to win 230 to 240 House seats.
How the Popular Vote Translates to Senate Seats

I drew that blue box and that’s where things are now. Even +5 to +6 is a Senate pickup of three.
It certainly could get worse for Republicans. I put margins of error in that box only to the downside of Democrats.
From a Gallup starting point of +10, the possible upside is +12 or +13, in a wide range centered between +6 and +12.
Silver has Ohio, Maine, and Michigan as “Lean Democrat” with North Carolina as “Likely”.
That’s a pickup of three, not counting Alaska and Texas which Silver calls tossups.
Senate Outlook
In the Senate, Republicans are fielding very weak candidates in Texas, Ohio, Iowa, North Carolina, and Maine.
Alaska has a weak incumbent Republican facing a screwy ranked voting system that will pit one Democrat against three Republicans (two of them with the same name, one the incumbent).
A Blue Wave only requires a pickup of two Senate seats. I expect Democrats to win four of those, with a clean sweep of all six in play.
Pollsters call Alaska a tossup. I don’t.
Based on ranked voting and the current political environment, I think Polymarket Alaska Senate is right with Democrat Mary Peltola at 64 percent.
Polymarket has Ohio Senate at 56 percent Democrat. Assuming Democrats hold in the Senate and flip Maine that’s a Senate takeover, and my minimum expectation right now.
The Trump Factor
Trump is likely to make matters worse for Republicans, perhaps much worse.
The war in Iran is unpopular, tariffs are unpopular, diesel is at record highs and climbing heading into Christmas shipping and Autumn crop harvesting.
Factor in series of inane proclamations on Truth Social, the trade war with Canada, and deportations.
To top it off, Trump wants to personally appear to support candidates. Other than a desperate Paxton in Texas, no Republican wants to be seen with a toxic Trump.
The preceding items point to stunning Democrat numbers with young voters, independents, and Hispanics.
Combine that with lackluster Republican turnout and you are looking at a potential +6 Senate win.
I have been discussing that possibility since January when it looked crazy. Now it doesn’t.
My current forecast is Democrat +4 or more with about a 60 percent confidence rating. Senate +3 or better is about 75 percent.
Related Posts Plus a Diesel Update
September 2, 2026: Is it Idiotic to Fight a War Over Something Worthless in Two Years?
My vote is yes, but that’s what Bessent says we are doing.
September 3, 2026: The Price of Diesel Hit a New Record on Gas Buddy, AAA Tomorrow
Diesel jumped nearly 10 cents today after 5 cents yesterday.
AAA did hit a new record on September 4 of $5.8500.
That record fell again today. As of September 5, the price of diesel is a new record $5.8819.
Expect to see $6.00 soon.
I repeat my August 2 warning: So, Don’t Be Shocked if Democrats Take Six Republican Senate Seats
The grim setup for Republicans in the midterms keeps building.






























I am someone who is amazed that many people are political party agnostic and will swing from voting for Democrats to voting for Republicans. I received my political education from my great grandfather who was born in 1894. His parents were “Lincoln Republicans.” He voted Republican until 1932 when he realized that the Republicans were no longer the party of Lincoln and that the FDR wing of the Democratic Party had much more in common with the Republican Party from Lincoln to Teddy Roosevelt. Because my great grandfather had principled political beliefs the last President he voted for was Clinton in 1996. He understood political history from Lincoln to Clinton better than anyone that I have every come across and because of that he knew that no political party would ever represent all of his opinions and beliefs, but he knew that the Democratic Party came much closer than the Republican Party. He knew that when it comes to politics that you cannot let the perfect be the enemy of the good.
Uniparty anyway. This is just optics.
People are looking for saviour who can take them to prosperous future.
But the government officials are bought by
Whoever come to Washington Blue or Red, are corrupt, criminal and finally pardoned themselves at the end of their term.
1976?
It ain’t over till it’s over. Never under-estimate the efforts of taco to get what he wants, regardless of what it takes to make it happen (emphasis on “whatever it takes”).
US party leadership is changing every 2,4 or 8 years.
How can the businesses can have concrete plans to navigate especially these times while competing seriously with China?
Between now and the next presidential election:
– boots on the ground in Iran
– A major “event” that drives another rise of Nationalism (eg 9/11, sinking of a carrier, etc)
Result will be a Trump 3d term. People will be screaming for it.
Go ahead and give me the thumbs down votes – I can take it.
He won’t live that long.
Todd,
You must be smoking some good stuff. I will put it this way. Nothing like Game of Thrones to bring this analogy. “We’ve had vicious kings, and we’ve had idiot kings, but I don’t think we’ve ever been cursed with a vicious idiot for a king!” Today, we had indeed.
No one would give a shit if a carrier sunk lol
Trump’s inane proclamations on TS remind me of Keynes’s observation: “Madmen in authority, who hear voices in the air, are distilling their frenzy from some academic scribbler of a few years back.” The only problem in the case of Trump is that his proclamations are so weird and moronic that it’s impossible to find an “academic scribbler” that could have inspired them. I hate to say this, but you have to wonder about the intelligence of people who keep saying they will vote for this kind of nonsense.
I think MAGA is simply a racist organization. In their minds Anything that hurts immigrants, people of color, different sexual orientation and foreigners, is worth the other BS that Trump doles out including corruption. I can’t think of any other explanation for voting for Trump. The other explanation out there is stupidity but I can’t believe so many people in certain deeply republican states can be that dumb.
The only problem with this explanation is the Latino and black voters who support him. I hope that has changed now and they have woken up to the fact that Trump is not their friend.
The only thing Trump is good at is making the rich richer and the poor poorer. Naturally the 1% is more likely to vote for him. So explain the other 33% who support him at this point.
Under the racism is the insecurity of the man that knows he’s a loser.
With all of the “other” and “only” this looked like an SAT test question.
Just let us know which Democrat made the POOR RICHER and the RICH poorer? NO? I cannot think of one either.
GO UNIPARTY! Thus, I do not vote.
Great, now do us a favor and vow yourself from babbling about how unimportant you are too.
Once in office, expect Team D to act like the corporate imperialist muppets they are, but this time, with pronouns!
Watch voters turn to Team R in disgust.
Wash, rinse, repeat.
Time to break the cycle and vote for a third party
I got bad news for you. The American electoral system is rigged to only allow two parties. What is happening is the third party is taking over the Democratic party – the Democratic Socialist.
Before you get your panties in a bunch… The Republican party was overtaken by the Nazi party 10 years ago.
This is the flaw. Without a multi-party electoral process, like the rest of the world, you have no option to dilute the fanatical crazy bastards from the left or the right with something more temperate and in the middle.
We absolutely must disable the electoral process such that we can realistically have multiple parties. Not just one more but many. This flies in the face of corporate control because they can’t afford to buy 8 parties every cycle and there will always be a ninth.
The DNC will make damn sure that only corporate imperialist muppets get through.
I up-voted you only because I agree that it is a simple rotation and the only difference is:
Which PARTY holds the Room with the best Cigars and Scotch on earth, all on us, when they negotiate each week’s Talking points.
The leadership decides everything in tandem and it is ALL a well-coordinated APPROVED “battle.”
Then, they leave the Room and practice making faces while speaking the names of the opposition party out loudly with well-rehearsed MEAN faces – – faces that look like they smelled a permanent Fart.
“Permanent smelled-a-fart faces.” That is Circus work.
That is GOVERNMENT.
ACTING. MAKING UP SHIT. TRYING TO BE CONVINCING.
SIMPLY FOCUS ON IMPROVEMENTS THAT ANY OF THOSE HIGHLY FOCUSED HUGE LOBBYING ARMS are achieving for US!! ???? WTF???
We are being regularly fucked by: INSURANCE, MEDICAL CARE, WARS, BIG PHARMA, and BIG TECH.
Think about all of those Favors that any one of those has done FOR US, we regulars.
A much more interesting Poll/Survey would be: whenever a party switch to dominance has occurred, how did that cross over affect: INSURANCE, MEDICAL CARE, WARS, BIG PHARMA, and BIG TECH. HOW IS MONEY AFFECTING WHAT WE CONTEND WITH AS REGULAR CITIZENS with no power.
I do not count VOTING as “powerful” because 90% of Campaign promises are not kept…may be worse!
Donald Trump Has No Idea of the Tidal Wave That’s Coming for Him Unless He Ends the Iran War
https://nationalsecurityjournal.org/donald-trump-has-no-idea-of-the-tidal-wave-thats-coming-for-him-unless-he-ends-the-iran-war/
For me, he’d have to end the war and bring the 168 twelve year old schoolgirls of Minab back to life. Even then, he’d be dead to me.
Zombie Schoolgirls? No thanks.
Maybe a dead trump? Please Lord, Please!
I took a poll and found none of them to be reliable because the left is crazy and everyone else just wants to live their lives.
Democrats want too many bike lanes. Republicans want a $1.5 trillion “defense” budget.
A little more honesty now that it is a War budget
I’ll take the bike lanes for $1.5B Alex
What are the chances that when Trump sees the writing on the wall and he’s exhausted all the legal shenanigans he declares martial law
I won’t take that bet
I’ve said this before here, people are running to the Democrats because the Republican party has become so vile they don’t see any other choice. If the Democrats actually gave a shit about working class people and modeled a policy platform around that overarching theme they would easily take over politics in this country. Instead, Democrats model their policy platform after identity politics which is a huge loser.
Policies that promote the working class are what Trump 1.0 and 2.0 promised. He failed miserably both times.
Politics serves those in the upper upper upper crust now. The majority of the public sees that clearly now.
Absolutely correct. Clinton decidedly turned the Democratic Party over to the finance and tech industry titans. In his defense, he personally made a fortune, and had to find a way to compete with the Gingrich Republicans for money and graft.
You should check out the DSA.
They care about “working class people”.
What’s their identity?
The ones I hear about the most are flipping Democrats into DSA because we only have a two party system
Kind of stock standard European dem-soc types (so not raving lunatic leftists, as much as Trump and pals cry about it). Which is to say entirely more qualified to run this nation than team “we eat crayons” and team “friends of the Klan” if only by the bar being low.
The headlines on Drudge tell you what you need to know about the upcoming election.
More Americans Identifying As Dems
Republicans Scrub Trump From Campaign Sites
https://www.theguardian.com/us-news/2026/sep/05/us-voters-democrats-republicans
Even Texas going blue tells you all you need to know.
I hope Talarico wins – mainly to embarrass Trump, but also so he’ll stop begging for money on YouTube. If Paxton wins, it’ll be because Texans prefer a crook to an obnoxious twerp.
Twerps are less harmful
what are the chances that 16 republicans grow a set of Massey balls and we get an impeachment that matters. Are there 16 republican senators that are not pedo protectors or pedos i dont think so but one can dream
ZERO. their prince of darkness, the crown prince of flyover fatsos would put a fatwa on them and their familes. REPUGS GETTING BALLS? TOO FUNNY. it’s trump’s party now. miss lindsay was killed by russians, too. he has balls.
The idea of miss lindsay being anything other than an ass-kissing sycophant means that this must be a joke.
putin has balls. miss lindsay was a gelding
Might not need that many after November.
Chances are zero.
A few years ago I moved far away from the big city and now live in a farm community. Which changes my algorithm.
The issue of farm inputs, fertilizer, getting more expensive is not a theory. The concern now is the absolute shortage of fertilizers for the planet. The amount of estimated sulfur production has been cut in half. Sulphur is required to make potash fertilizer.
doesn’t the usa export about 30% or so of our food. couldn’t most of flyover country folks stand to lose a few chins by not eating so much? the bread basket of central CA will rule the empire. perhaps it’s time to bring our baby killing military back stateside to be a republic and not a world wide warmongering empire. don’t be frightened, most amerikans can just buy some new belts not fitted for fatsos.
We import a lot of food because we don’t grow everything. Most of the Great plains grow soybeans or corn and much of that corn is not for human consumption. It’s either feed grain or ethanol grain.
Regardless of your understanding of food imports and exports, when the input material is cut by half that is not a trivial impact.
This shortage is not going to be limited to Iowa. It is going to be global.
And your comments about tightening the belt and such tells me that you’re not well read on the subject
i would bet you anything the fat fucks in iowa won’t starve. bailouts most likely.
You have a good scientific view of this problem.
There may be a more immediate geopolitical aspect, though – the US imports much potash from Canada, and the US government’s trade stance is currently threatening this vital supply chain.
You cannot make potash without sulfur as an input. The amount of sulfur expected to be produced this year is 45 million tons. That’s down from a typical 75 million tons.
That’s a huge impact.
Typical. TPTB have their differences and agendas and everyone else suffers for it…